| Red | Green | Blue | |
| z | 17.64 | ||
| znorm | Inf | ||
| sky | -Inf | -Inf | -Inf |
| S/N | 26.1 | 45.2 | 47.0 |
| S/N(c) | 0.0 | 0.0 | 0.0 |
| SN(E/C) |
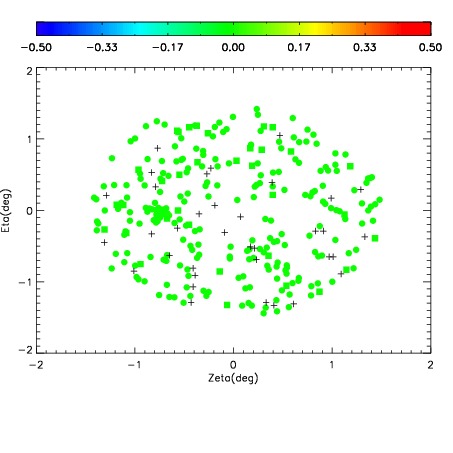
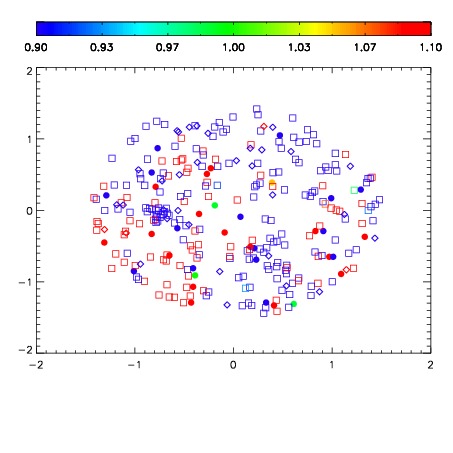
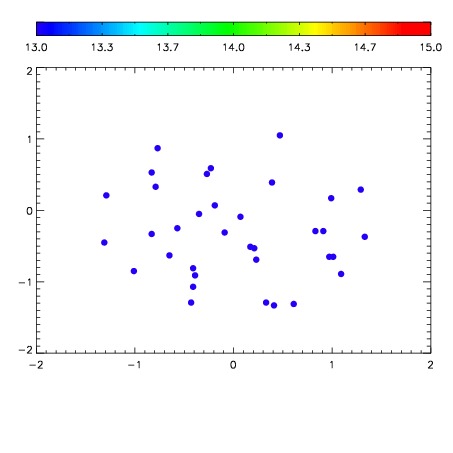

| Frame | Nreads | Zeropoints | Mag plots | Spatial mag deviation | Spatial sky 16325A emission deviations (filled: sky, open: star) | Spatial sky continuum emission | Spatial sky telluric CO2 absorption deviations (filled: H < 10) | |||||||||||||||||||||||
| 0 | 0 |
|
|
|
|
|
|
| IPAIR | NAME | SHIFT | NEWSHIFT | S/N | NAME | SHIFT | NEWSHIFT | S/N |
| 0 | 11380043 | 0.473851 | 0.00000 | 19.0200 | 11380040 | -0.00153490 | 0.475386 | 19.0337 |
| 1 | 11380039 | 0.472910 | 0.000941008 | 18.9770 | 11380041 | -0.00144044 | 0.475291 | 18.9962 |
| 2 | 11380042 | 0.473478 | 0.000373006 | 18.9724 | 11380044 | -0.000521625 | 0.474373 | 18.9504 |
| 3 | 11380038 | 0.472475 | 0.00137600 | 18.9669 | 11380037 | 0.00000 | 0.473851 | 18.9227 |