| Red | Green | Blue | |
| z | 17.64 | ||
| znorm | Inf | ||
| sky | -Inf | -Inf | -Inf |
| S/N | 27.7 | 46.9 | 47.5 |
| S/N(c) | 0.0 | 0.0 | 0.0 |
| SN(E/C) |
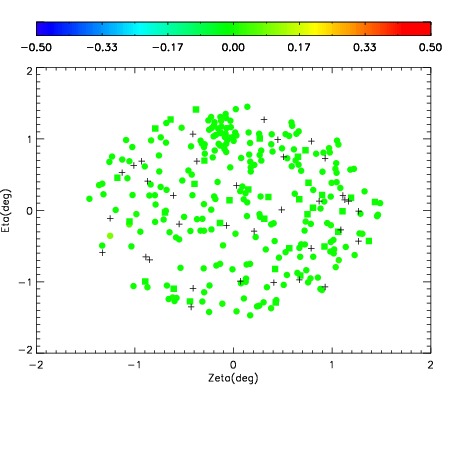
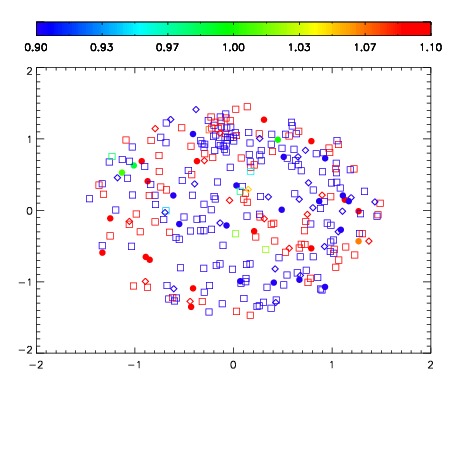
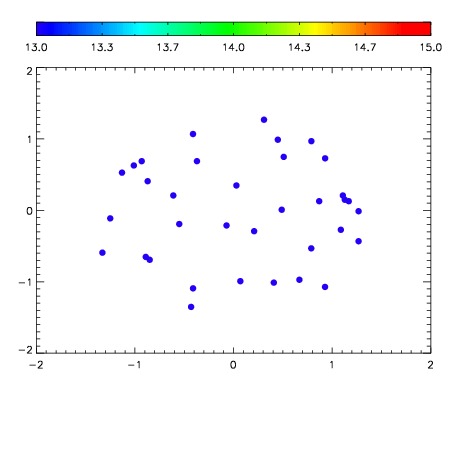

| Frame | Nreads | Zeropoints | Mag plots | Spatial mag deviation | Spatial sky 16325A emission deviations (filled: sky, open: star) | Spatial sky continuum emission | Spatial sky telluric CO2 absorption deviations (filled: H < 10) | |||||||||||||||||||||||
| 0 | 0 |
|
|
|
|
|
|
| IPAIR | NAME | SHIFT | NEWSHIFT | S/N | NAME | SHIFT | NEWSHIFT | S/N |
| 0 | 10220102 | 0.495993 | 0.00000 | 19.1799 | 10220103 | 0.00172412 | 0.494269 | 19.1991 |
| 1 | 10220101 | 0.495598 | 0.000395000 | 19.1792 | 10220100 | 0.00142574 | 0.494567 | 19.1806 |
| 2 | 10220098 | 0.494659 | 0.00133398 | 19.1292 | 10220099 | 0.00171390 | 0.494279 | 19.1716 |
| 3 | 10220097 | 0.494056 | 0.00193700 | 19.1079 | 10220096 | 0.00000 | 0.495993 | 19.0408 |