| Red | Green | Blue | |
| z | 17.64 | ||
| znorm | Inf | ||
| sky | -Inf | -NaN | -NaN |
| S/N | 23.9 | 41.8 | 42.0 |
| S/N(c) | 0.0 | 0.0 | 0.0 |
| SN(E/C) |
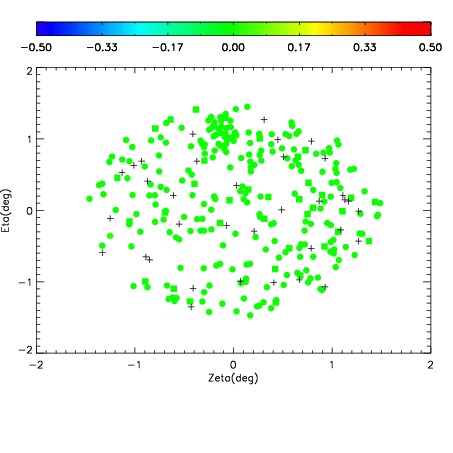
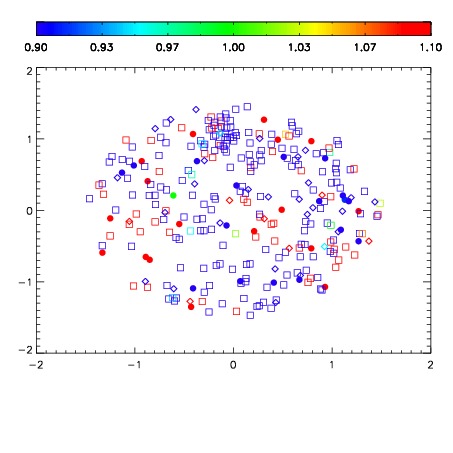
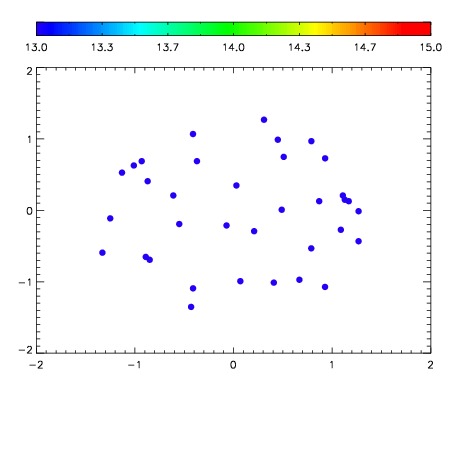

| Frame | Nreads | Zeropoints | Mag plots | Spatial mag deviation | Spatial sky 16325A emission deviations (filled: sky, open: star) | Spatial sky continuum emission | Spatial sky telluric CO2 absorption deviations (filled: H < 10) | |||||||||||||||||||||||
| 0 | 0 |
|
|
|
|
|
|
| IPAIR | NAME | SHIFT | NEWSHIFT | S/N | NAME | SHIFT | NEWSHIFT | S/N |
| 0 | 10270084 | 0.495633 | 0.00000 | 18.9139 | 10270079 | 0.00000 | 0.495633 | 18.9588 |
| 1 | 10270080 | 0.494809 | 0.000824004 | 19.0399 | 10270083 | 0.00323269 | 0.492400 | 18.9939 |
| 2 | 10270081 | 0.495577 | 5.59986e-05 | 18.9930 | 10270082 | 0.00296137 | 0.492672 | 18.9772 |
| 3 | 10270085 | 0.495489 | 0.000144005 | 18.8727 | 10270086 | 0.00259630 | 0.493037 | 18.9334 |