| Frame | Nreads | Zeropoints | Mag plots
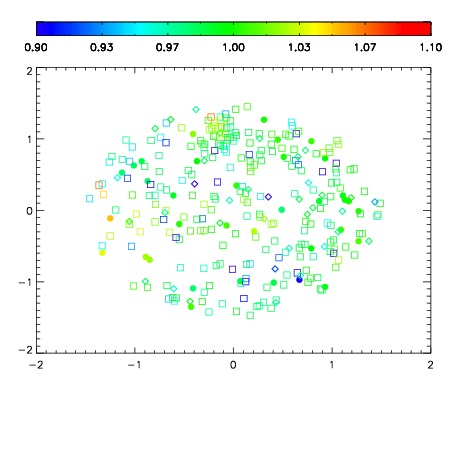
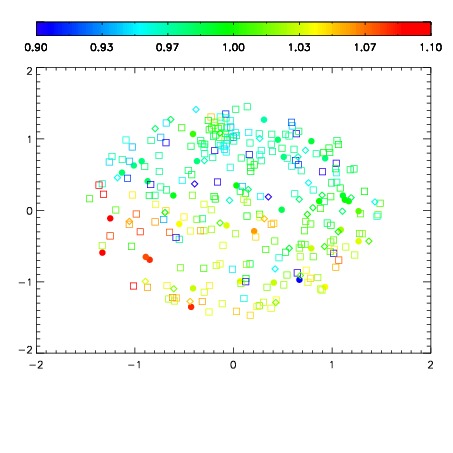
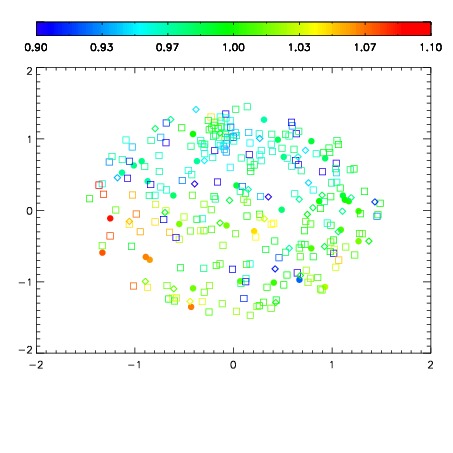
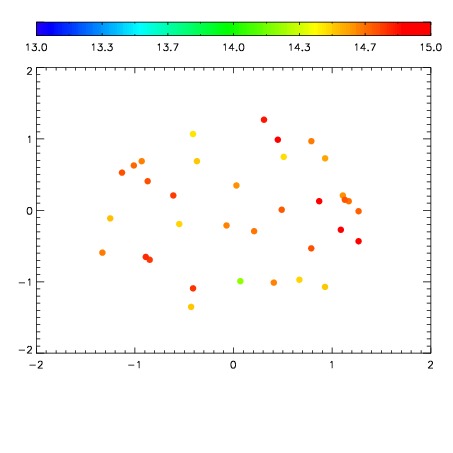
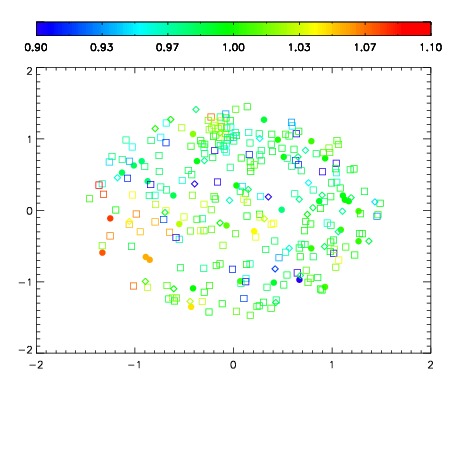
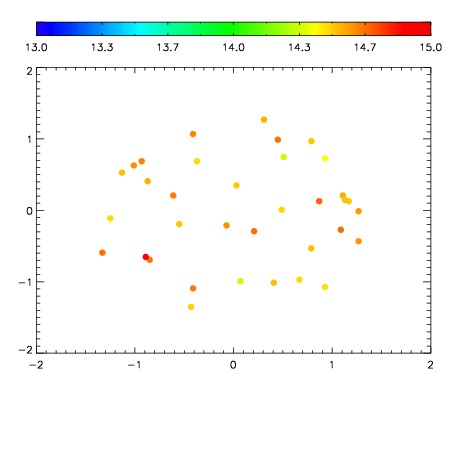
| Spatial mag deviation
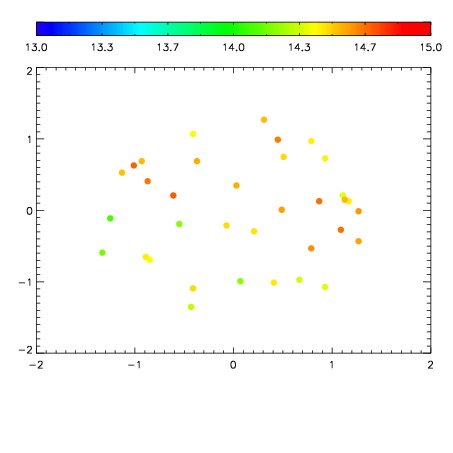
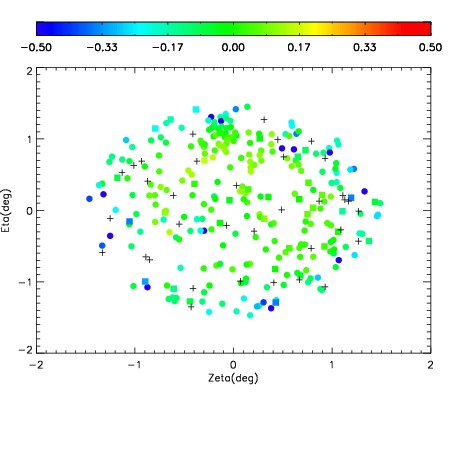
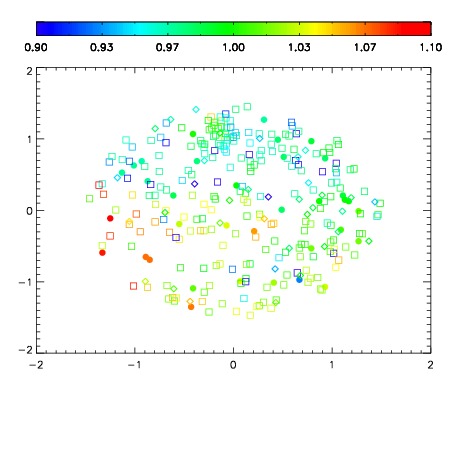
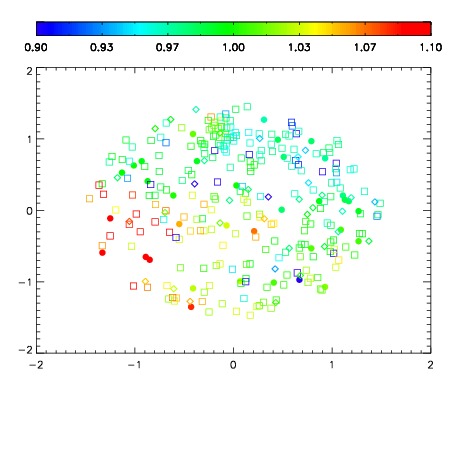
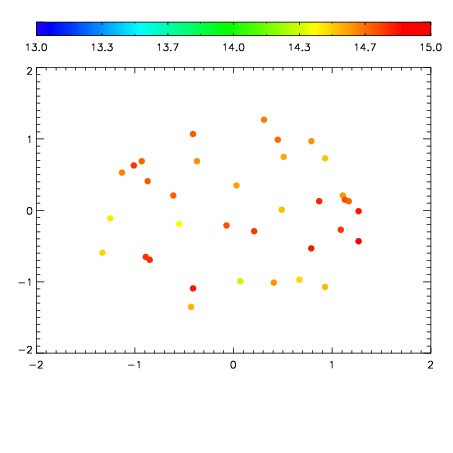
| Spatial sky 16325A emission deviations (filled: sky, open: star)
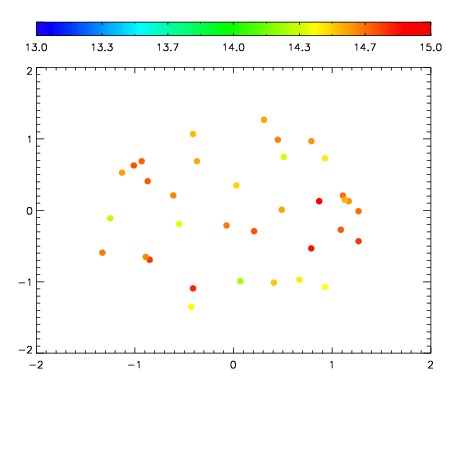
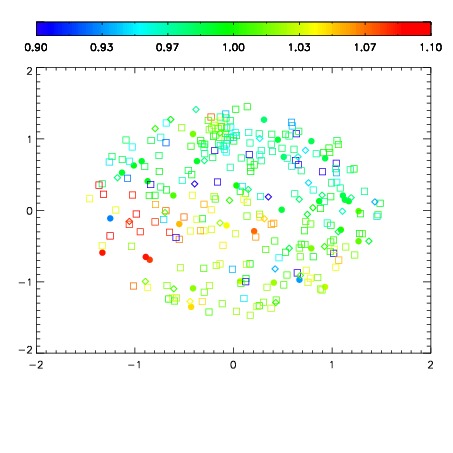
| Spatial sky continuum emission
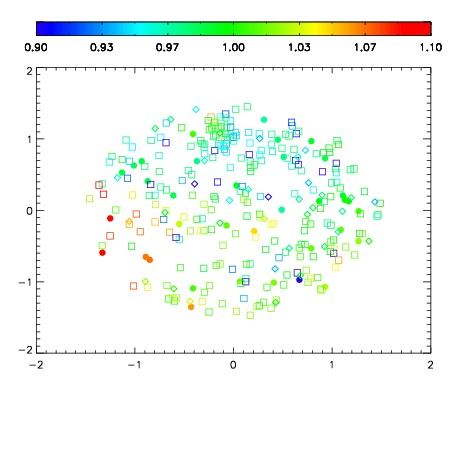
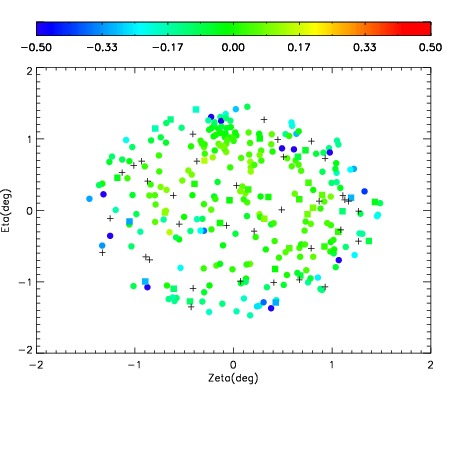
| Spatial sky telluric CO2 absorption deviations (filled: H < 10)
|
| 10790069
| 47
| | Red | Green | Blue
| | z | | 18.54
| | znorm | | 14.36
| | sky | 14.9 | 14.5 | 14.2
| | S/N | 10.1 | 17.4 | 16.5
| | S/N(c) | 25.5 | 17.9 | 9.8
| | SN(E/C) 0.98
|
| 
| 
| 
| 
| 
|
| 10790070
| 47
| | Red | Green | Blue
| | z | | 18.60
| | znorm | | 14.41
| | sky | 14.9 | 14.5 | 14.5
| | S/N | 10.2 | 17.8 | 17.5
| | S/N(c) | 26.1 | 18.1 | 10.2
| | SN(E/C) 0.96
|
| 
| 
| 
| 
| 
|
| 10790071
| 47
| | Red | Green | Blue
| | z | | 18.61
| | znorm | | 14.43
| | sky | 14.7 | 14.5 | 14.5
| | S/N | 10.5 | 17.7 | 17.4
| | S/N(c) | 26.3 | 18.4 | 10.3
| | SN(E/C) 0.98
|
| 
| 
| 
| 
| 
|
| 10790072
| 47
| | Red | Green | Blue
| | z | | 18.77
| | znorm | | 14.59
| | sky | 14.7 | 14.6 | 14.6
| | S/N | 11.5 | 19.9 | 20.1
| | S/N(c) | 28.6 | 20.0 | 11.3
| | SN(E/C) 0.99
|
| 
| 
| 
| 
| 
|
| 10790073
| 47
| | Red | Green | Blue
| | z | | 18.57
| | znorm | | 14.39
| | sky | 15.0 | 14.7 | 14.6
| | S/N | 10.1 | 17.6 | 18.0
| | S/N(c) | 25.7 | 18.3 | 10.4
| | SN(E/C) 0.97
|
| 
| 
| 
| 
| 
|
| 10790074
| 47
| | Red | Green | Blue
| | z | | 18.49
| | znorm | | 14.31
| | sky | 14.8 | 14.6 | 14.6
| | S/N | 9.6 | 17.1 | 17.1
| | S/N(c) | 24.4 | 17.6 | 10.0
| | SN(E/C) 0.98
|
| 
| 
| 
| 
| 
|
| 10790075
| 47
| | Red | Green | Blue
| | z | | 18.64
| | znorm | | 14.46
| | sky | 14.9 | 14.7 | 14.6
| | S/N | 10.6 | 18.4 | 18.8
| | S/N(c) | 26.7 | 19.0 | 10.8
| | SN(E/C) 0.98
|
| 
| 
| 
| 
| 
|
| 10790076
| 47
| | Red | Green | Blue
| | z | | 18.55
| | znorm | | 14.37
| | sky | 14.6 | 14.6 | 14.6
| | S/N | 9.6 | 16.8 | 17.4
| | S/N(c) | 25.4 | 18.2 | 10.3
| | SN(E/C) 1.01
|
| 
| 
| 
| 
| 
|