| Red | Green | Blue | |
| z | 17.64 | ||
| znorm | Inf | ||
| sky | -Inf | -Inf | -Inf |
| S/N | 18.1 | 32.3 | 33.2 |
| S/N(c) | 0.0 | 0.0 | 0.0 |
| SN(E/C) |
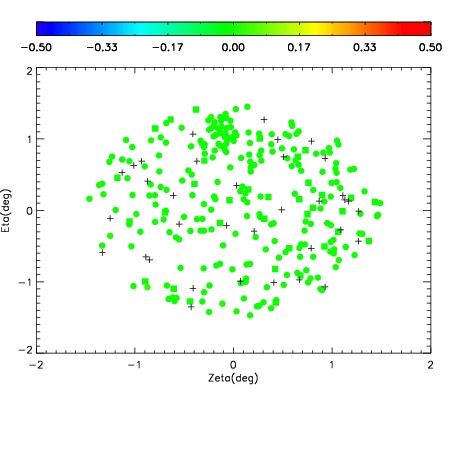
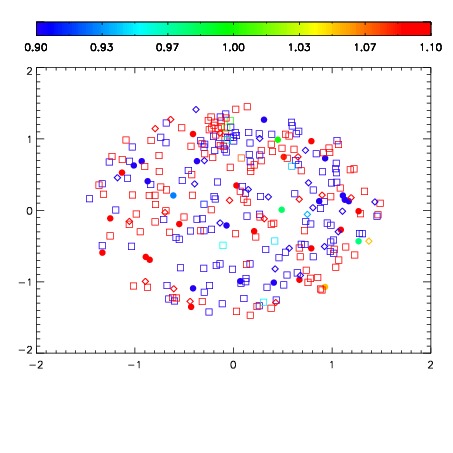
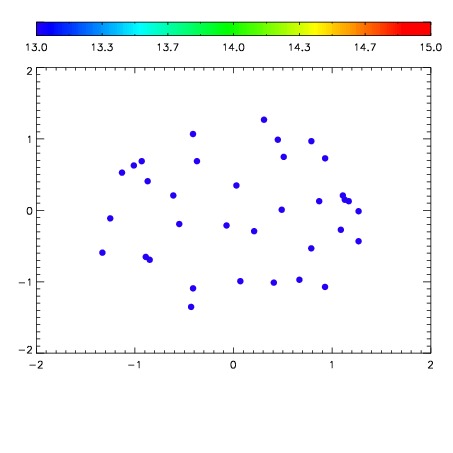

| Frame | Nreads | Zeropoints | Mag plots | Spatial mag deviation | Spatial sky 16325A emission deviations (filled: sky, open: star) | Spatial sky continuum emission | Spatial sky telluric CO2 absorption deviations (filled: H < 10) | |||||||||||||||||||||||
| 0 | 0 |
|
|
|
|
|
|
| IPAIR | NAME | SHIFT | NEWSHIFT | S/N | NAME | SHIFT | NEWSHIFT | S/N |
| 0 | 10790071 | 0.495619 | 0.00000 | 18.5948 | 10790073 | -0.00110764 | 0.496727 | 18.5557 |
| 1 | 10790075 | 0.494989 | 0.000629991 | 18.6140 | 10790072 | -0.00129770 | 0.496917 | 18.7545 |
| 2 | 10790070 | 0.494891 | 0.000728011 | 18.5733 | 10790076 | -0.00122511 | 0.496844 | 18.5372 |
| 3 | 10790074 | 0.494414 | 0.00120500 | 18.4744 | 10790069 | 0.00000 | 0.495619 | 18.5290 |