| Red | Green | Blue | |
| z | 17.64 | ||
| znorm | Inf | ||
| sky | -Inf | -Inf | -Inf |
| S/N | 31.9 | 54.8 | 59.1 |
| S/N(c) | 0.0 | 0.0 | 0.0 |
| SN(E/C) |
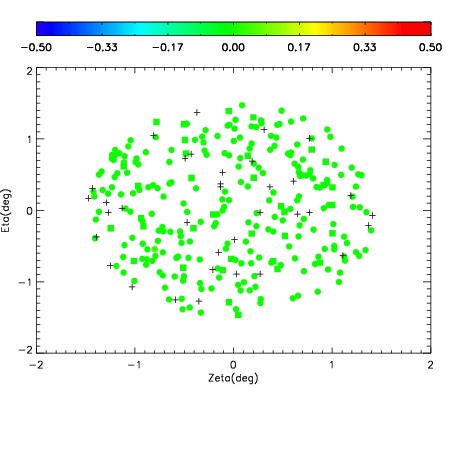
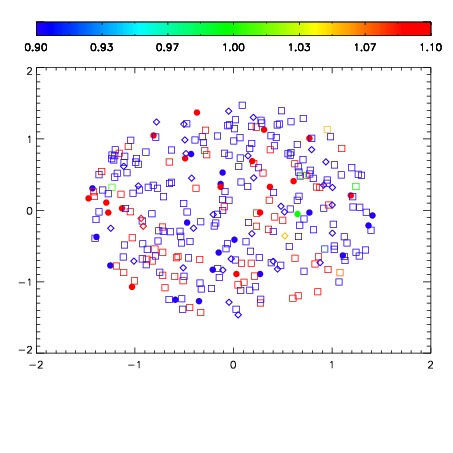


| Frame | Nreads | Zeropoints | Mag plots | Spatial mag deviation | Spatial sky 16325A emission deviations (filled: sky, open: star) | Spatial sky continuum emission | Spatial sky telluric CO2 absorption deviations (filled: H < 10) | |||||||||||||||||||||||
| 0 | 0 |
|
|
|
|
|
|
| IPAIR | NAME | SHIFT | NEWSHIFT | S/N | NAME | SHIFT | NEWSHIFT | S/N |
| 0 | 11040066 | 0.477132 | 0.00000 | 19.0198 | 11040060 | 0.00000 | 0.477132 | 18.9562 |
| 1 | 11040070 | 0.475379 | 0.00175300 | 19.1072 | 11040064 | -0.00327075 | 0.480403 | 19.0903 |
| 2 | 11040061 | 0.476784 | 0.000348002 | 19.0736 | 11040063 | -0.00232371 | 0.479456 | 19.0847 |
| 3 | 11040062 | 0.477100 | 3.19779e-05 | 19.0714 | 11040067 | -0.00378117 | 0.480913 | 19.0721 |
| 4 | 11040065 | 0.476946 | 0.000185996 | 19.0594 | 11040071 | -0.00598762 | 0.483120 | 19.0579 |
| 5 | 11040069 | 0.475129 | 0.00200298 | 19.0516 | 11040068 | -0.00408359 | 0.481216 | 19.0162 |