| Red | Green | Blue | |
| z | 17.64 | ||
| znorm | Inf | ||
| sky | -Inf | -NaN | -Inf |
| S/N | 22.6 | 39.2 | 41.6 |
| S/N(c) | 0.0 | 0.0 | 0.0 |
| SN(E/C) |
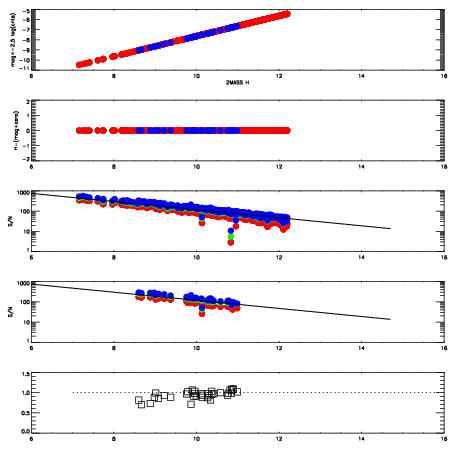
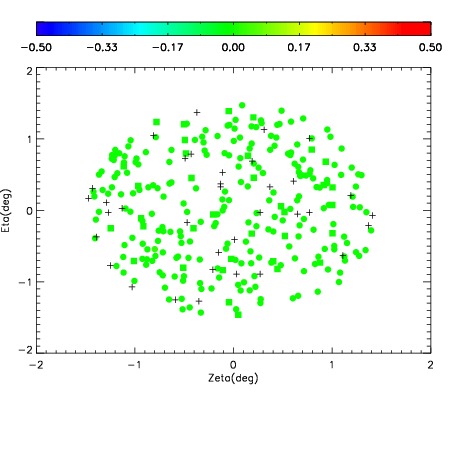
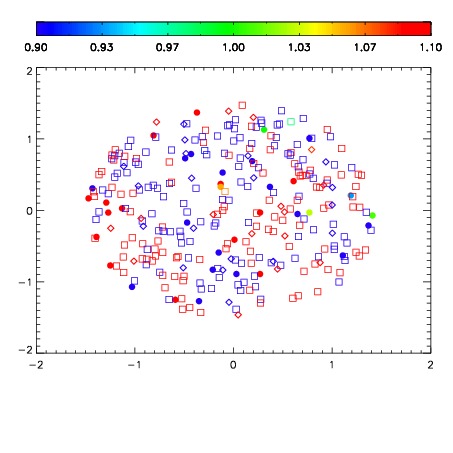
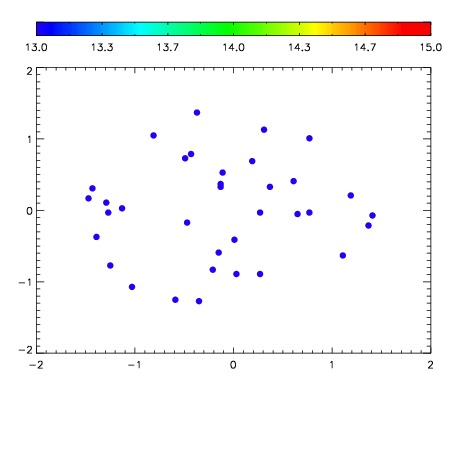

| Frame | Nreads | Zeropoints | Mag plots | Spatial mag deviation | Spatial sky 16325A emission deviations (filled: sky, open: star) | Spatial sky continuum emission | Spatial sky telluric CO2 absorption deviations (filled: H < 10) | |||||||||||||||||||||||
| 0 | 0 |
|
|
|
|
|
|
| IPAIR | NAME | SHIFT | NEWSHIFT | S/N | NAME | SHIFT | NEWSHIFT | S/N |
| 0 | 11090062 | 0.474771 | 0.00000 | 18.9260 | 11090060 | 0.00000 | 0.474771 | 18.8822 |
| 1 | 11090061 | 0.474091 | 0.000680000 | 18.9766 | 11090063 | -0.00258807 | 0.477359 | 18.8842 |
| 2 | 11090065 | 0.473882 | 0.000889003 | 18.9101 | 11090064 | -0.00260660 | 0.477378 | 18.8802 |
| 3 | 11090066 | 0.473403 | 0.00136799 | 18.8949 | 11090067 | -0.00476796 | 0.479539 | 18.8577 |