| Red | Green | Blue | |
| z | 17.64 | ||
| znorm | Inf | ||
| sky | -NaN | -Inf | -Inf |
| S/N | 27.1 | 47.5 | 48.9 |
| S/N(c) | 0.0 | 0.0 | 0.0 |
| SN(E/C) |
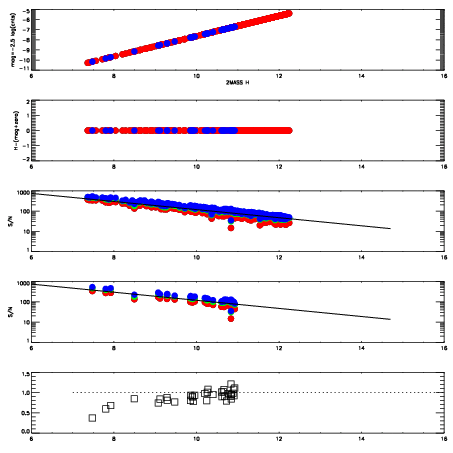


| Frame | Nreads | Zeropoints | Mag plots | Spatial mag deviation | Spatial sky 16325A emission deviations (filled: sky, open: star) | Spatial sky continuum emission | Spatial sky telluric CO2 absorption deviations (filled: H < 10) | |||||||||||||||||||||||
| 0 | 0 |
|
|
|
|
|
|
| IPAIR | NAME | SHIFT | NEWSHIFT | S/N | NAME | SHIFT | NEWSHIFT | S/N |
| 0 | 10240098 | 0.496642 | 0.00000 | 19.1666 | 10240099 | 0.000370905 | 0.496271 | 19.1876 |
| 1 | 10240097 | 0.496114 | 0.000528008 | 19.0815 | 10240096 | -0.000485170 | 0.497127 | 19.0868 |
| 2 | 10240093 | 0.495183 | 0.00145900 | 19.0635 | 10240092 | 0.00000 | 0.496642 | 19.0829 |
| 3 | 10240094 | 0.494827 | 0.00181499 | 19.0412 | 10240095 | 4.48007e-05 | 0.496597 | 19.0453 |