| Red | Green | Blue | |
| z | 17.64 | ||
| znorm | Inf | ||
| sky | -Inf | -Inf | -Inf |
| S/N | 30.2 | 49.0 | 54.4 |
| S/N(c) | 0.0 | 0.0 | 0.0 |
| SN(E/C) |
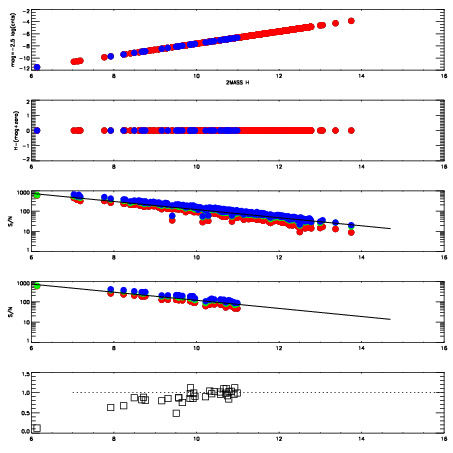
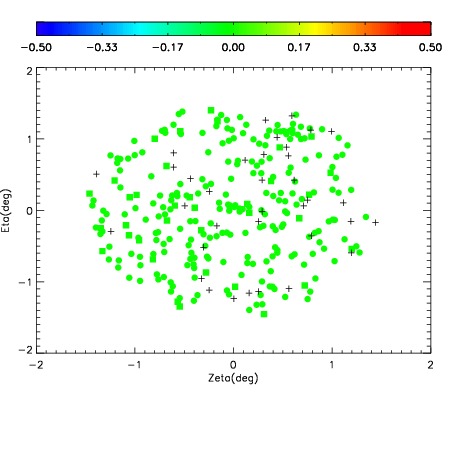
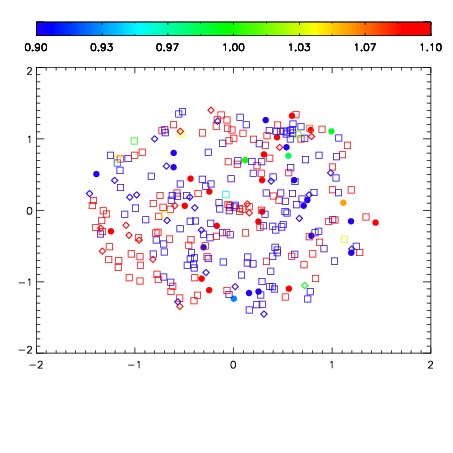
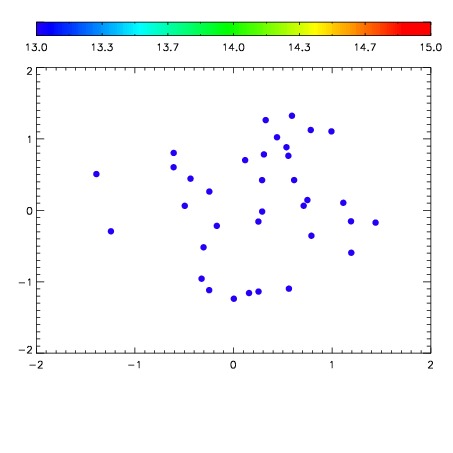

| Frame | Nreads | Zeropoints | Mag plots | Spatial mag deviation | Spatial sky 16325A emission deviations (filled: sky, open: star) | Spatial sky continuum emission | Spatial sky telluric CO2 absorption deviations (filled: H < 10) | |||||||||||||||||||||||
| 0 | 0 |
|
|
|
|
|
|
| IPAIR | NAME | SHIFT | NEWSHIFT | S/N | NAME | SHIFT | NEWSHIFT | S/N |
| 0 | 06930075 | 0.491842 | 0.00000 | 19.1068 | 06930077 | 0.000560908 | 0.491281 | 19.0876 |
| 1 | 06930074 | 0.490294 | 0.00154799 | 19.1936 | 06930073 | 0.00000 | 0.491842 | 19.1710 |
| 2 | 06930078 | 0.490413 | 0.00142899 | 19.1144 | 06930080 | 0.00150472 | 0.490337 | 19.1382 |
| 3 | 06930079 | 0.491550 | 0.000292003 | 19.0063 | 06930076 | 0.00156681 | 0.490275 | 19.0587 |