| Red | Green | Blue | |
| z | 17.64 | ||
| znorm | Inf | ||
| sky | -Inf | -Inf | -Inf |
| S/N | 34.3 | 56.1 | 61.9 |
| S/N(c) | 0.0 | 0.0 | 0.0 |
| SN(E/C) |
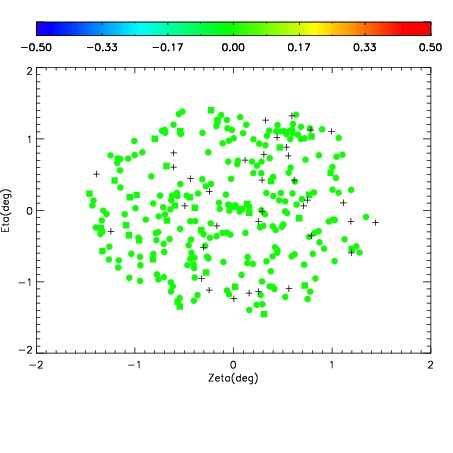
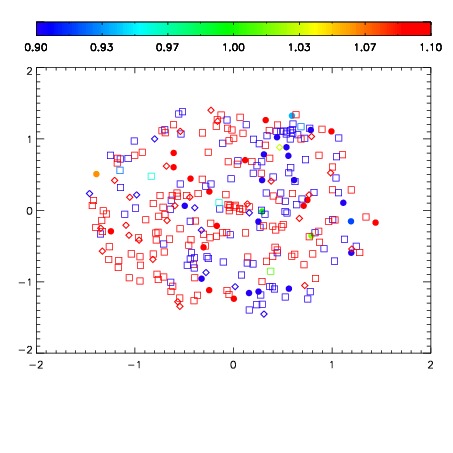
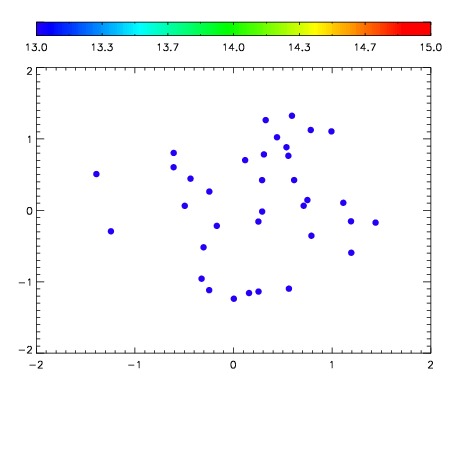

| Frame | Nreads | Zeropoints | Mag plots | Spatial mag deviation | Spatial sky 16325A emission deviations (filled: sky, open: star) | Spatial sky continuum emission | Spatial sky telluric CO2 absorption deviations (filled: H < 10) | |||||||||||||||||||||||
| 0 | 0 |
|
|
|
|
|
|
| IPAIR | NAME | SHIFT | NEWSHIFT | S/N | NAME | SHIFT | NEWSHIFT | S/N |
| 0 | 06980076 | 0.487151 | 0.00000 | 19.2075 | 06980077 | 0.00301108 | 0.484140 | 19.2016 |
| 1 | 06980075 | 0.485778 | 0.00137299 | 19.1980 | 06980078 | 0.00235878 | 0.484792 | 19.1974 |
| 2 | 06980072 | 0.483491 | 0.00365999 | 19.1936 | 06980073 | 0.00163408 | 0.485517 | 19.1898 |
| 3 | 06980071 | 0.482817 | 0.00433400 | 19.1873 | 06980074 | 0.00223728 | 0.484914 | 19.1897 |
| 4 | 06980079 | 0.481904 | 0.00524700 | 19.1740 | 06980070 | 0.00000 | 0.487151 | 19.1689 |