| Red | Green | Blue | |
| z | 17.64 | ||
| znorm | Inf | ||
| sky | -NaN | -Inf | -Inf |
| S/N | 21.6 | 37.1 | 41.6 |
| S/N(c) | 0.0 | 0.0 | 0.0 |
| SN(E/C) |

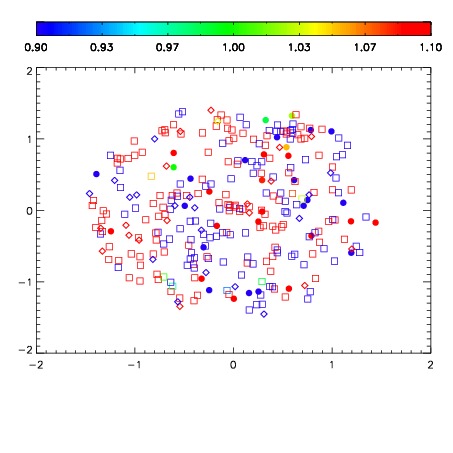
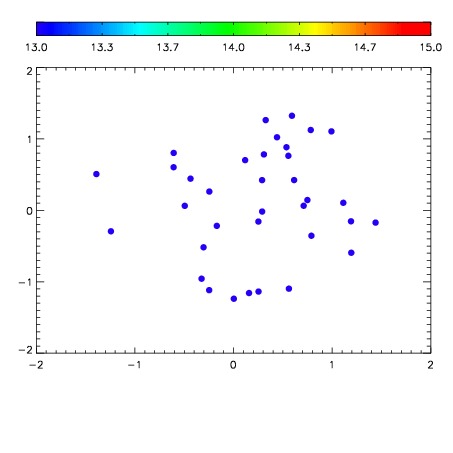

| Frame | Nreads | Zeropoints | Mag plots | Spatial mag deviation | Spatial sky 16325A emission deviations (filled: sky, open: star) | Spatial sky continuum emission | Spatial sky telluric CO2 absorption deviations (filled: H < 10) | |||||||||||||||||||||||
| 0 | 0 |
|
|
|
|
|
|
| IPAIR | NAME | SHIFT | NEWSHIFT | S/N | NAME | SHIFT | NEWSHIFT | S/N |
| 0 | 07200065 | 0.481696 | 0.00000 | 18.7169 | 07200066 | 0.00355792 | 0.478138 | 18.6470 |
| 1 | 07200064 | 0.480571 | 0.00112501 | 18.6539 | 07200063 | 0.000350723 | 0.481345 | 18.6438 |
| 2 | 07200060 | 0.477646 | 0.00405002 | 18.6016 | 07200059 | 0.00000 | 0.481696 | 18.5732 |
| 3 | 07200061 | 0.477954 | 0.00374201 | 18.5692 | 07200062 | 0.00499240 | 0.476704 | 18.5142 |