| Red | Green | Blue | |
| z | 17.64 | ||
| znorm | Inf | ||
| sky | -NaN | -Inf | -Inf |
| S/N | 30.4 | 53.0 | 56.9 |
| S/N(c) | 0.0 | 0.0 | 0.0 |
| SN(E/C) |
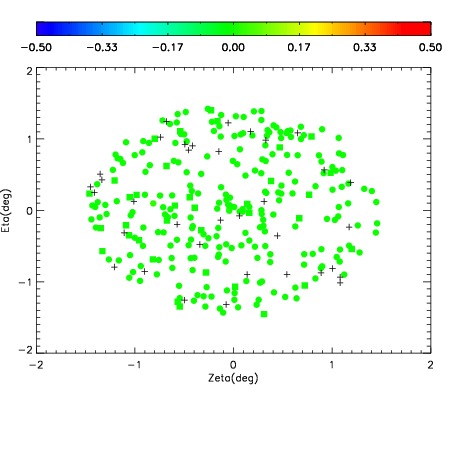
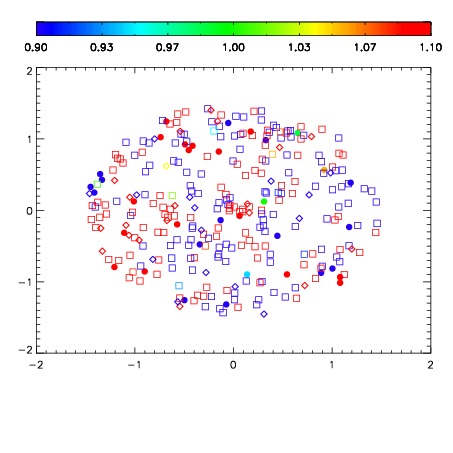
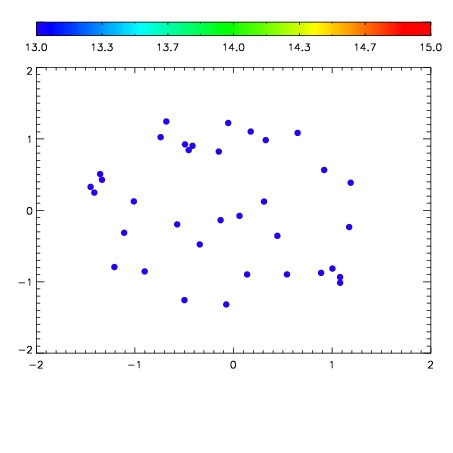

| Frame | Nreads | Zeropoints | Mag plots | Spatial mag deviation | Spatial sky 16325A emission deviations (filled: sky, open: star) | Spatial sky continuum emission | Spatial sky telluric CO2 absorption deviations (filled: H < 10) | |||||||||||||||||||||||
| 0 | 0 |
|
|
|
|
|
|
| IPAIR | NAME | SHIFT | NEWSHIFT | S/N | NAME | SHIFT | NEWSHIFT | S/N |
| 0 | 06940073 | 0.497247 | 0.00000 | 19.0053 | 06940079 | -0.00141221 | 0.498659 | 19.0143 |
| 1 | 06940074 | 0.497123 | 0.000124007 | 19.0871 | 06940076 | -0.00149785 | 0.498745 | 19.0858 |
| 2 | 06940078 | 0.495397 | 0.00185001 | 19.0841 | 06940083 | -0.00134796 | 0.498595 | 19.0785 |
| 3 | 06940082 | 0.494295 | 0.00295201 | 19.0688 | 06940072 | 0.00000 | 0.497247 | 19.0522 |
| 4 | 06940081 | 0.494015 | 0.00323200 | 19.0306 | 06940075 | -0.00172808 | 0.498975 | 19.0160 |
| 5 | 06940077 | 0.495117 | 0.00213000 | 18.9982 | 06940080 | 0.000487286 | 0.496760 | 18.9753 |