| Red | Green | Blue | |
| z | 17.64 | ||
| znorm | Inf | ||
| sky | -Inf | -Inf | -Inf |
| S/N | 32.9 | 54.1 | 59.1 |
| S/N(c) | 0.0 | 0.0 | 0.0 |
| SN(E/C) |
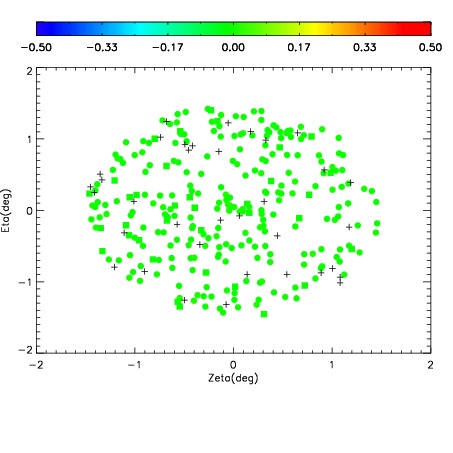
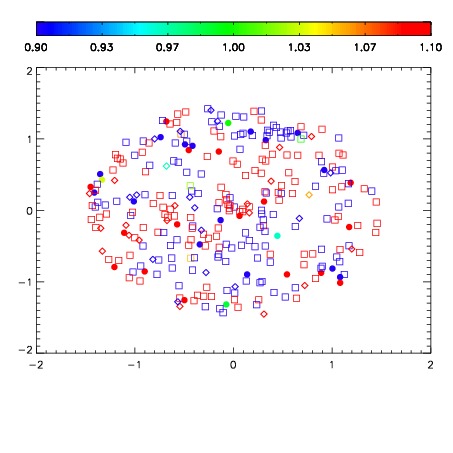
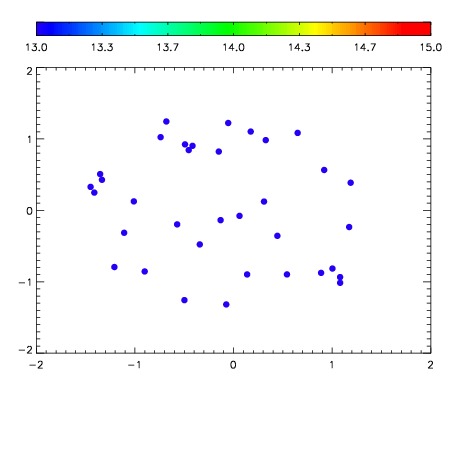

| Frame | Nreads | Zeropoints | Mag plots | Spatial mag deviation | Spatial sky 16325A emission deviations (filled: sky, open: star) | Spatial sky continuum emission | Spatial sky telluric CO2 absorption deviations (filled: H < 10) | |||||||||||||||||||||||
| 0 | 0 |
|
|
|
|
|
|
| IPAIR | NAME | SHIFT | NEWSHIFT | S/N | NAME | SHIFT | NEWSHIFT | S/N |
| 0 | 06990066 | 0.484327 | 0.00000 | 19.2150 | 06990068 | -0.00128859 | 0.485616 | 19.2220 |
| 1 | 06990065 | 0.478625 | 0.00570199 | 19.2120 | 06990067 | -0.000105424 | 0.484432 | 19.2100 |
| 2 | 06990069 | 0.478925 | 0.00540200 | 19.2110 | 06990071 | -0.000345763 | 0.484673 | 19.2079 |
| 3 | 06990070 | 0.482258 | 0.00206900 | 19.1882 | 06990072 | 0.000765531 | 0.483561 | 19.1861 |
| 4 | 06990073 | 0.479675 | 0.00465199 | 19.1239 | 06990064 | 0.00000 | 0.484327 | 19.1800 |