| Red | Green | Blue | |
| z | 17.64 | ||
| znorm | Inf | ||
| sky | -Inf | -Inf | -Inf |
| S/N | 12.2 | 23.4 | 24.6 |
| S/N(c) | 0.0 | 0.0 | 0.0 |
| SN(E/C) |
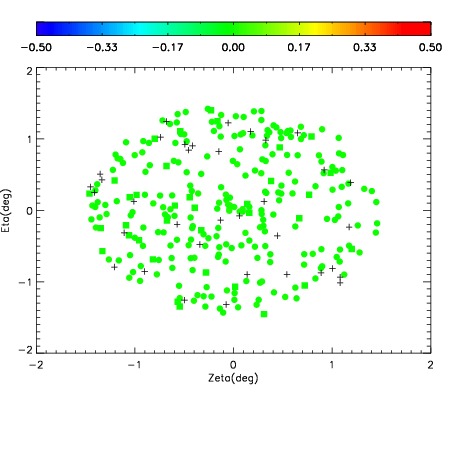
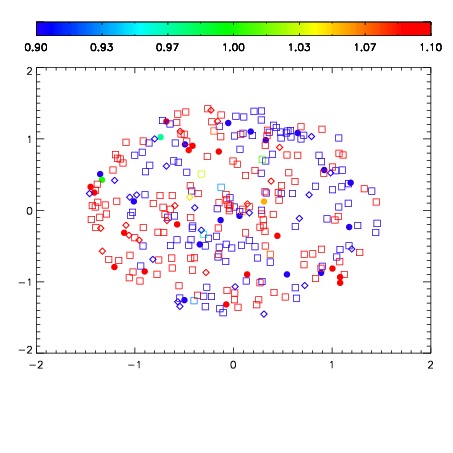
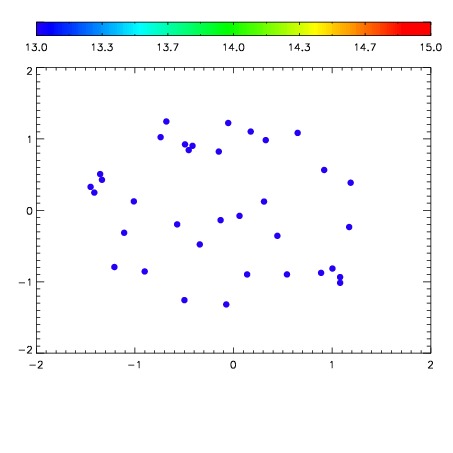

| Frame | Nreads | Zeropoints | Mag plots | Spatial mag deviation | Spatial sky 16325A emission deviations (filled: sky, open: star) | Spatial sky continuum emission | Spatial sky telluric CO2 absorption deviations (filled: H < 10) | |||||||||||||||||||||||
| 0 | 0 |
|
|
|
|
|
|
| IPAIR | NAME | SHIFT | NEWSHIFT | S/N | NAME | SHIFT | NEWSHIFT | S/N |
| 0 | 07210065 | 0.486103 | 0.00000 | 16.3159 | 07210063 | 0.00192165 | 0.484181 | 17.1725 |
| 1 | 07210061 | 0.483843 | 0.00226000 | 18.5177 | 07210062 | 0.00151610 | 0.484587 | 18.5434 |
| 2 | 07210060 | 0.483743 | 0.00235999 | 18.1466 | 07210059 | 0.00000 | 0.486103 | 18.3842 |
| 3 | 07210064 | 0.485077 | 0.00102600 | 14.9060 | 07210066 | 2.47124e-05 | 0.486078 | 16.7712 |