| Red | Green | Blue | |
| z | 17.64 | ||
| znorm | Inf | ||
| sky | -Inf | -Inf | -NaN |
| S/N | 28.4 | 47.8 | 52.6 |
| S/N(c) | 0.0 | 0.0 | 0.0 |
| SN(E/C) |
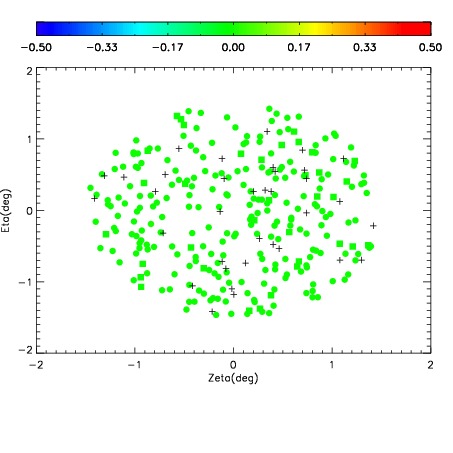
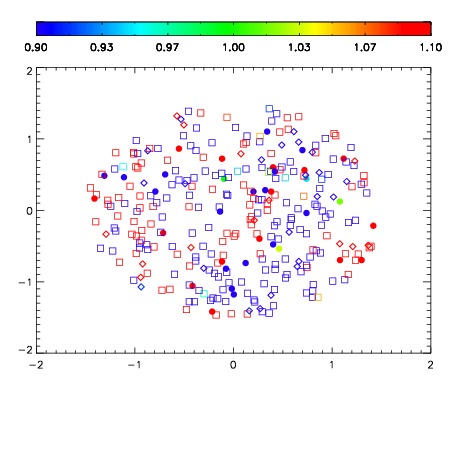


| Frame | Nreads | Zeropoints | Mag plots | Spatial mag deviation | Spatial sky 16325A emission deviations (filled: sky, open: star) | Spatial sky continuum emission | Spatial sky telluric CO2 absorption deviations (filled: H < 10) | |||||||||||||||||||||||
| 0 | 0 |
|
|
|
|
|
|
| IPAIR | NAME | SHIFT | NEWSHIFT | S/N | NAME | SHIFT | NEWSHIFT | S/N |
| 0 | 10440031 | 0.502325 | 0.00000 | 19.1401 | 10440032 | 0.00265323 | 0.499672 | 19.1285 |
| 1 | 10440030 | 0.501766 | 0.000558972 | 19.0852 | 10440028 | 0.00101958 | 0.501305 | 19.0675 |
| 2 | 10440026 | 0.500903 | 0.00142199 | 19.0812 | 10440029 | 0.000873062 | 0.501452 | 19.0567 |
| 3 | 10440027 | 0.500848 | 0.00147700 | 19.0273 | 10440025 | 0.00000 | 0.502325 | 18.9886 |