| Red | Green | Blue | |
| z | 17.64 | ||
| znorm | Inf | ||
| sky | -NaN | -NaN | -Inf |
| S/N | 20.3 | 35.1 | 38.7 |
| S/N(c) | 0.0 | 0.0 | 0.0 |
| SN(E/C) |
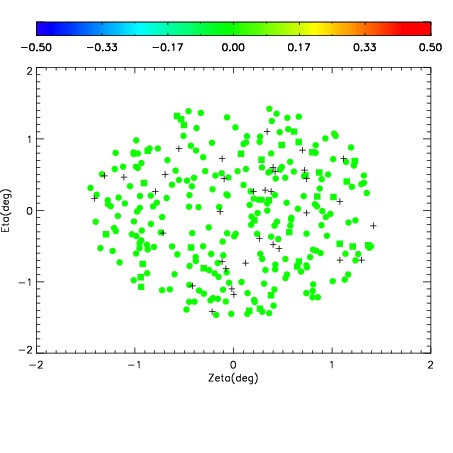
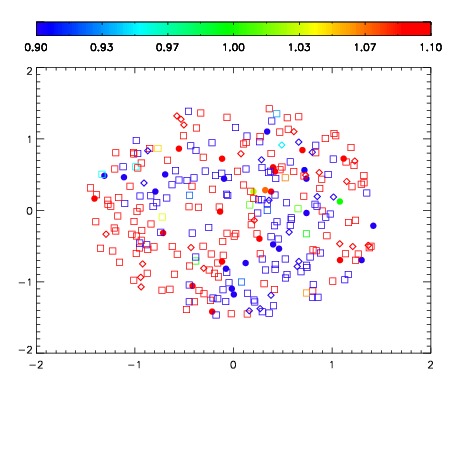
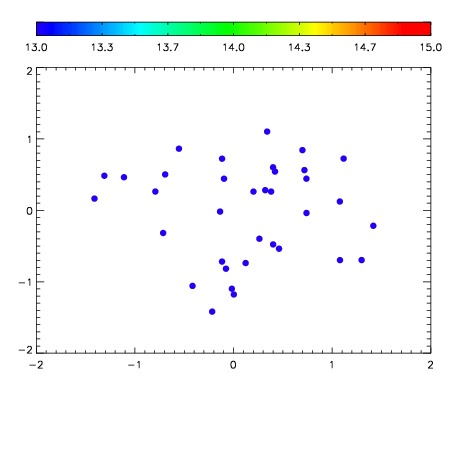

| Frame | Nreads | Zeropoints | Mag plots | Spatial mag deviation | Spatial sky 16325A emission deviations (filled: sky, open: star) | Spatial sky continuum emission | Spatial sky telluric CO2 absorption deviations (filled: H < 10) | |||||||||||||||||||||||
| 0 | 0 |
|
|
|
|
|
|
| IPAIR | NAME | SHIFT | NEWSHIFT | S/N | NAME | SHIFT | NEWSHIFT | S/N |
| 0 | 10660013 | 0.513695 | 0.00000 | 18.4635 | 10660011 | 0.00000 | 0.513695 | 18.6854 |
| 1 | 10660016 | 0.511560 | 0.00213498 | 18.8315 | 10660014 | 0.00301363 | 0.510681 | 18.7503 |
| 2 | 10660012 | 0.513497 | 0.000198007 | 18.6350 | 10660015 | 0.00235499 | 0.511340 | 18.6906 |
| 3 | 10660017 | 0.512652 | 0.00104302 | 18.0144 | 10660018 | 0.00131711 | 0.512378 | 18.4296 |