| Red | Green | Blue | |
| z | 17.64 | ||
| znorm | Inf | ||
| sky | -Inf | -NaN | -Inf |
| S/N | 28.7 | 46.7 | 50.4 |
| S/N(c) | 0.0 | 0.0 | 0.0 |
| SN(E/C) |
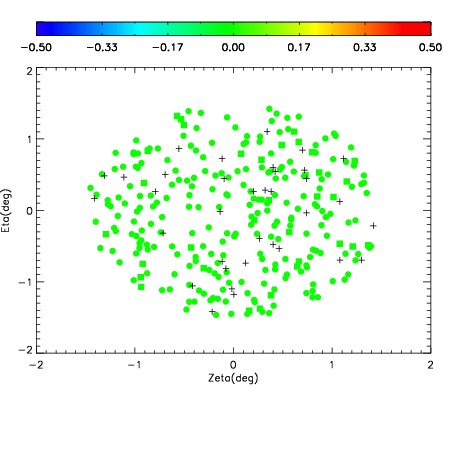
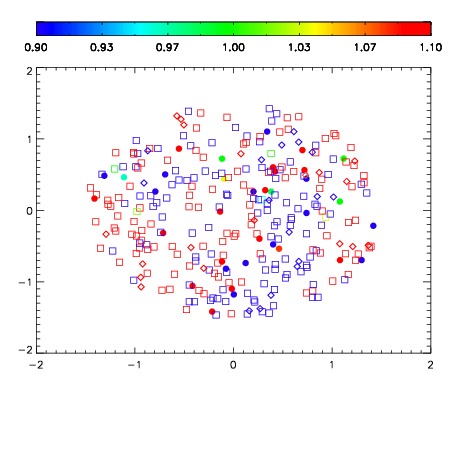
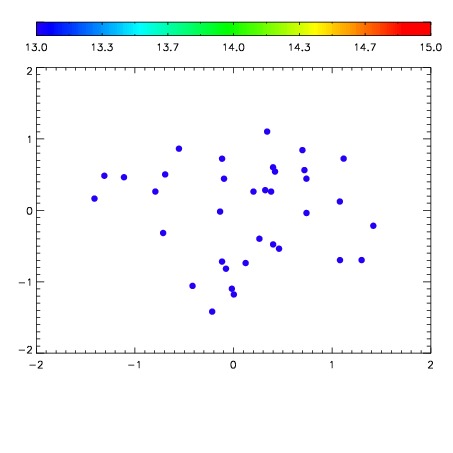

| Frame | Nreads | Zeropoints | Mag plots | Spatial mag deviation | Spatial sky 16325A emission deviations (filled: sky, open: star) | Spatial sky continuum emission | Spatial sky telluric CO2 absorption deviations (filled: H < 10) | |||||||||||||||||||||||
| 0 | 0 |
|
|
|
|
|
|
| IPAIR | NAME | SHIFT | NEWSHIFT | S/N | NAME | SHIFT | NEWSHIFT | S/N |
| 0 | 10750012 | 0.493877 | 0.00000 | 19.0505 | 10750014 | -0.00232122 | 0.496198 | 19.0847 |
| 1 | 10750013 | 0.493628 | 0.000248998 | 19.0931 | 10750018 | -0.00182183 | 0.495699 | 19.1093 |
| 2 | 10750016 | 0.489682 | 0.00419500 | 19.0807 | 10750011 | 0.00000 | 0.493877 | 19.0866 |
| 3 | 10750017 | 0.490082 | 0.00379500 | 19.0480 | 10750015 | -0.00211688 | 0.495994 | 19.0179 |