| Red | Green | Blue | |
| z | 17.64 | ||
| znorm | Inf | ||
| sky | -Inf | -Inf | -Inf |
| S/N | 26.2 | 45.6 | 48.4 |
| S/N(c) | 0.0 | 0.0 | 0.0 |
| SN(E/C) |
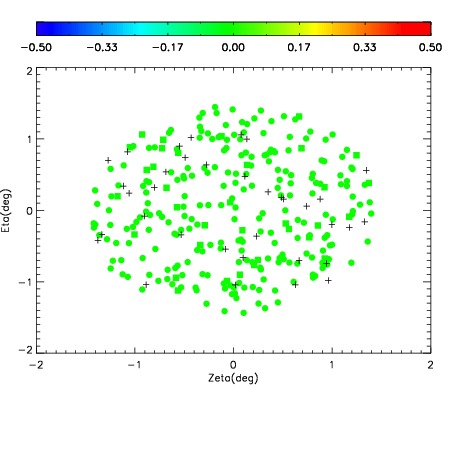
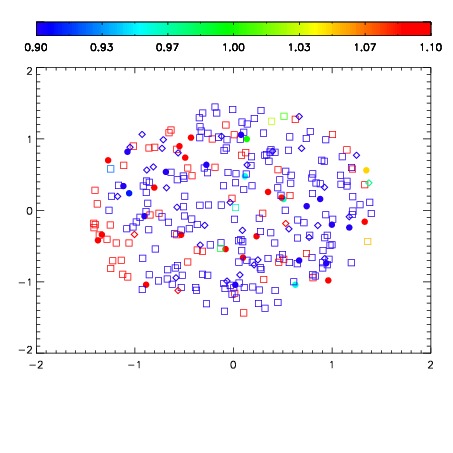


| Frame | Nreads | Zeropoints | Mag plots | Spatial mag deviation | Spatial sky 16325A emission deviations (filled: sky, open: star) | Spatial sky continuum emission | Spatial sky telluric CO2 absorption deviations (filled: H < 10) | |||||||||||||||||||||||
| 0 | 0 |
|
|
|
|
|
|
| IPAIR | NAME | SHIFT | NEWSHIFT | S/N | NAME | SHIFT | NEWSHIFT | S/N |
| 0 | 10160052 | 0.500173 | 0.00000 | 19.0033 | 10160057 | 0.00455833 | 0.495615 | 18.8567 |
| 1 | 10160056 | 0.500115 | 5.79953e-05 | 19.0950 | 10160054 | 0.00212242 | 0.498051 | 19.0803 |
| 2 | 10160055 | 0.499216 | 0.000956982 | 19.0685 | 10160050 | 0.00000 | 0.500173 | 19.0397 |
| 3 | 10160051 | 0.499414 | 0.000758976 | 19.0106 | 10160053 | 0.00198179 | 0.498191 | 18.9779 |