| Red | Green | Blue | |
| z | 17.64 | ||
| znorm | Inf | ||
| sky | -Inf | -Inf | -Inf |
| S/N | 31.8 | 51.6 | 58.7 |
| S/N(c) | 0.0 | 0.0 | 0.0 |
| SN(E/C) |
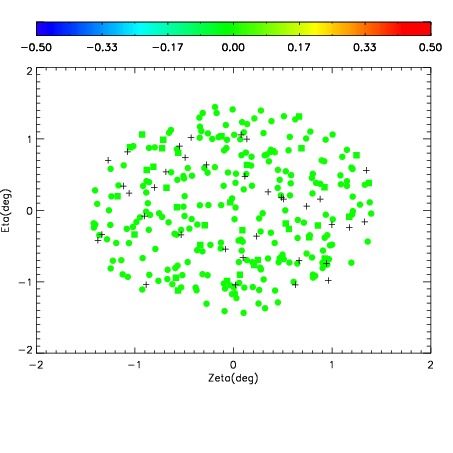
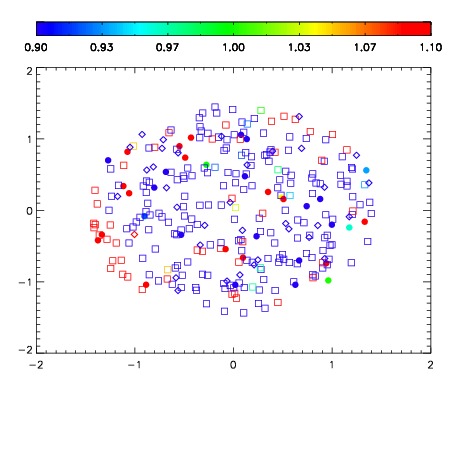
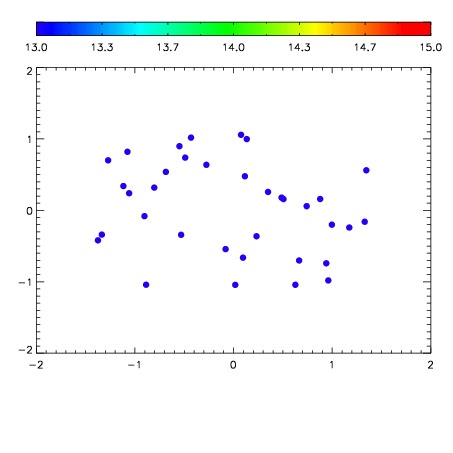

| Frame | Nreads | Zeropoints | Mag plots | Spatial mag deviation | Spatial sky 16325A emission deviations (filled: sky, open: star) | Spatial sky continuum emission | Spatial sky telluric CO2 absorption deviations (filled: H < 10) | |||||||||||||||||||||||
| 0 | 0 |
|
|
|
|
|
|
| IPAIR | NAME | SHIFT | NEWSHIFT | S/N | NAME | SHIFT | NEWSHIFT | S/N |
| 0 | 10210054 | 0.491291 | 0.00000 | 19.1270 | 10210056 | 0.00354616 | 0.487745 | 19.1338 |
| 1 | 10210057 | 0.491272 | 1.89841e-05 | 19.1097 | 10210055 | 0.00339000 | 0.487901 | 19.1316 |
| 2 | 10210053 | 0.490642 | 0.000648975 | 19.1066 | 10210052 | 0.00656783 | 0.484723 | 19.0861 |
| 3 | 10210050 | 0.490356 | 0.000934988 | 19.0864 | 10210048 | 0.00000 | 0.491291 | 19.0169 |
| 4 | 10210049 | 0.490064 | 0.00122699 | 19.0614 | 10210051 | 0.00722665 | 0.484064 | 19.0085 |