| Red | Green | Blue | |
| z | 17.64 | ||
| znorm | Inf | ||
| sky | -NaN | -NaN | -Inf |
| S/N | 29.5 | 48.7 | 52.5 |
| S/N(c) | 0.0 | 0.0 | 0.0 |
| SN(E/C) |
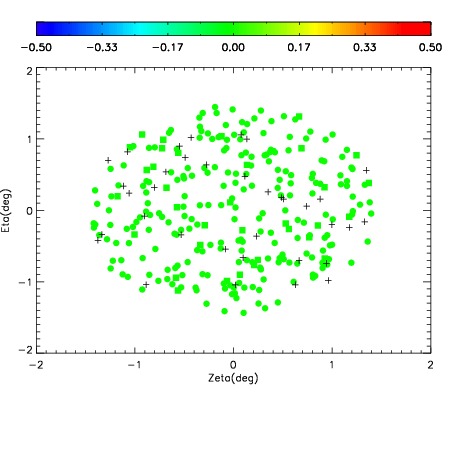
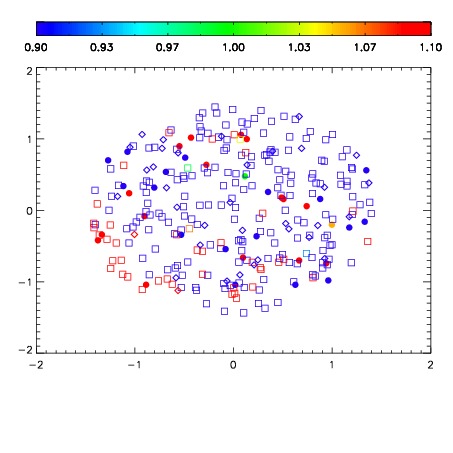


| Frame | Nreads | Zeropoints | Mag plots | Spatial mag deviation | Spatial sky 16325A emission deviations (filled: sky, open: star) | Spatial sky continuum emission | Spatial sky telluric CO2 absorption deviations (filled: H < 10) | |||||||||||||||||||||||
| 0 | 0 |
|
|
|
|
|
|
| IPAIR | NAME | SHIFT | NEWSHIFT | S/N | NAME | SHIFT | NEWSHIFT | S/N |
| 0 | 10440042 | 0.500765 | 0.00000 | 19.1956 | 10440043 | -0.00394123 | 0.504706 | 19.2120 |
| 1 | 10440041 | 0.500426 | 0.000339031 | 19.1908 | 10440040 | -0.00261051 | 0.503376 | 19.1822 |
| 2 | 10440037 | 0.499763 | 0.00100201 | 19.1768 | 10440036 | 0.00000 | 0.500765 | 19.1459 |
| 3 | 10440038 | 0.500205 | 0.000560045 | 19.1537 | 10440039 | -0.00322255 | 0.503988 | 19.1401 |