| Red | Green | Blue | |
| z | 17.64 | ||
| znorm | Inf | ||
| sky | -NaN | -NaN | -NaN |
| S/N | 30.0 | 50.3 | 54.1 |
| S/N(c) | 0.0 | 0.0 | 0.0 |
| SN(E/C) |
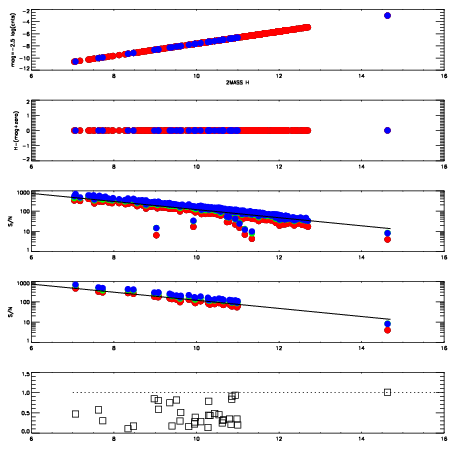


| Frame | Nreads | Zeropoints | Mag plots | Spatial mag deviation | Spatial sky 16325A emission deviations (filled: sky, open: star) | Spatial sky continuum emission | Spatial sky telluric CO2 absorption deviations (filled: H < 10) | |||||||||||||||||||||||
| 0 | 0 |
|
|
|
|
|
|
| IPAIR | NAME | SHIFT | NEWSHIFT | S/N | NAME | SHIFT | NEWSHIFT | S/N |
| 0 | 10220055 | 0.496315 | 0.00000 | 19.1886 | 10220050 | 0.00000 | 0.496315 | 19.1944 |
| 1 | 10220052 | 0.492975 | 0.00334001 | 19.2313 | 10220053 | 0.00359187 | 0.492723 | 19.2192 |
| 2 | 10220051 | 0.492631 | 0.00368401 | 19.2234 | 10220054 | 0.00399234 | 0.492323 | 19.2031 |
| 3 | 10220056 | 0.495966 | 0.000349015 | 19.1671 | 10220057 | 0.00305233 | 0.493263 | 19.1756 |