| Red | Green | Blue | |
| z | 17.64 | ||
| znorm | Inf | ||
| sky | -NaN | -NaN | -NaN |
| S/N | 29.1 | 48.9 | 52.3 |
| S/N(c) | 0.0 | 0.0 | 0.0 |
| SN(E/C) |
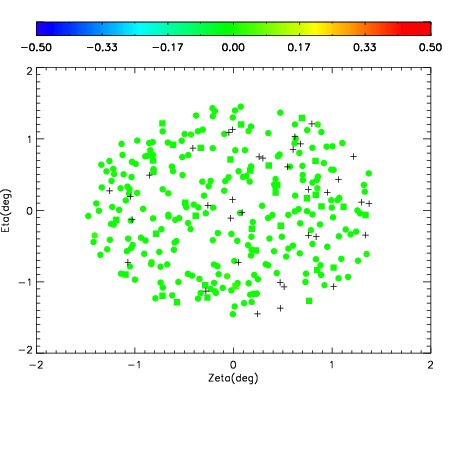

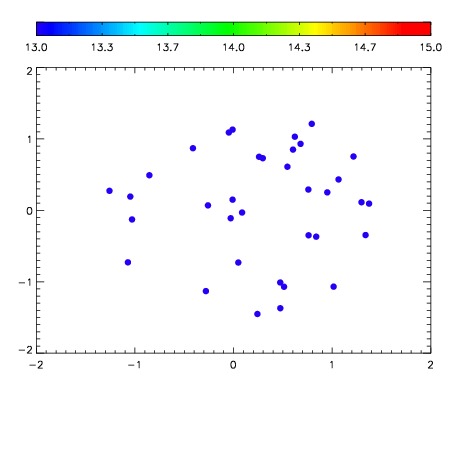

| Frame | Nreads | Zeropoints | Mag plots | Spatial mag deviation | Spatial sky 16325A emission deviations (filled: sky, open: star) | Spatial sky continuum emission | Spatial sky telluric CO2 absorption deviations (filled: H < 10) | |||||||||||||||||||||||
| 0 | 0 |
|
|
|
|
|
|
| IPAIR | NAME | SHIFT | NEWSHIFT | S/N | NAME | SHIFT | NEWSHIFT | S/N |
| 0 | 10260053 | 0.487615 | 0.00000 | 19.2138 | 10260054 | 0.00134174 | 0.486273 | 19.2169 |
| 1 | 10260052 | 0.487412 | 0.000202984 | 19.2024 | 10260051 | 0.00240416 | 0.485211 | 19.1863 |
| 2 | 10260049 | 0.487140 | 0.000474989 | 19.1937 | 10260050 | 0.00311533 | 0.484500 | 19.1777 |
| 3 | 10260048 | 0.487269 | 0.000345975 | 19.1741 | 10260047 | 0.00000 | 0.487615 | 19.1066 |