| Red | Green | Blue | |
| z | 17.64 | ||
| znorm | Inf | ||
| sky | -Inf | -Inf | -Inf |
| S/N | 24.9 | 41.6 | 46.4 |
| S/N(c) | 0.0 | 0.0 | 0.0 |
| SN(E/C) |
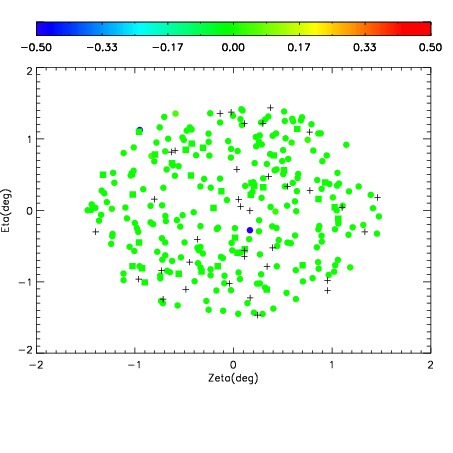
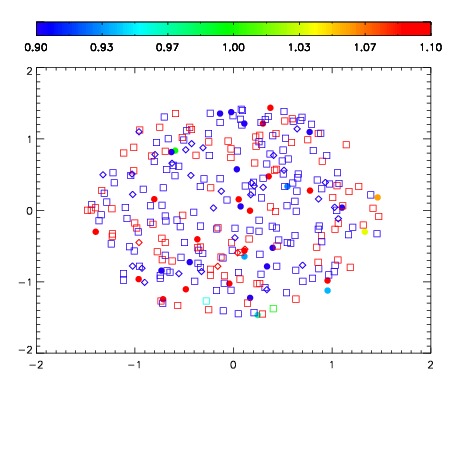
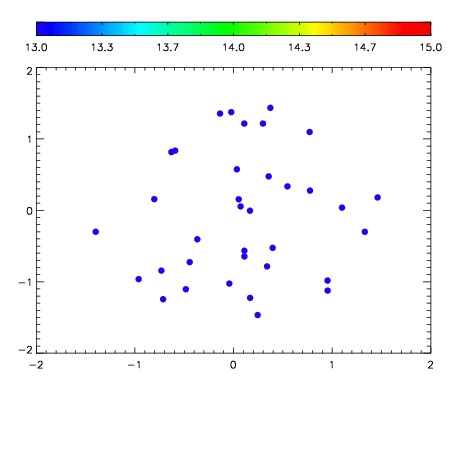

| Frame | Nreads | Zeropoints | Mag plots | Spatial mag deviation | Spatial sky 16325A emission deviations (filled: sky, open: star) | Spatial sky continuum emission | Spatial sky telluric CO2 absorption deviations (filled: H < 10) | |||||||||||||||||||||||
| 0 | 0 |
|
|
|
|
|
|
| IPAIR | NAME | SHIFT | NEWSHIFT | S/N | NAME | SHIFT | NEWSHIFT | S/N |
| 0 | 10250049 | 0.492870 | 0.00000 | 19.0896 | 10250048 | 0.00000 | 0.492870 | 19.0547 |
| 1 | 10250053 | 0.491378 | 0.00149199 | 19.0804 | 10250052 | 0.00362407 | 0.489246 | 19.0428 |
| 2 | 10250050 | 0.492789 | 8.10027e-05 | 19.0788 | 10250051 | 0.00339057 | 0.489479 | 18.9791 |
| 3 | 10250054 | 0.491741 | 0.00112900 | 19.0044 | 10250055 | 0.00422813 | 0.488642 | 18.6740 |