| Red | Green | Blue | |
| z | 17.64 | ||
| znorm | Inf | ||
| sky | -Inf | -Inf | -Inf |
| S/N | 25.5 | 45.1 | 48.1 |
| S/N(c) | 0.0 | 0.0 | 0.0 |
| SN(E/C) |
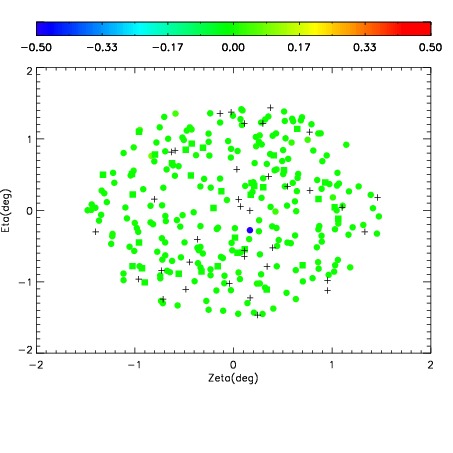
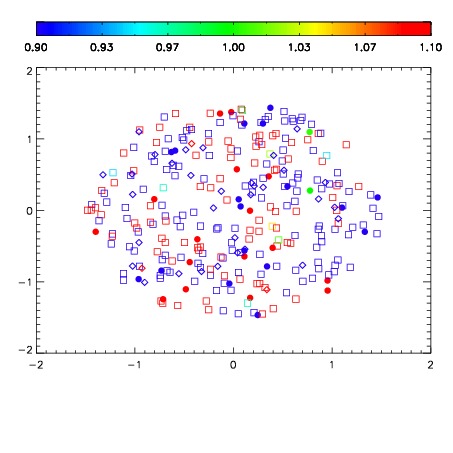


| Frame | Nreads | Zeropoints | Mag plots | Spatial mag deviation | Spatial sky 16325A emission deviations (filled: sky, open: star) | Spatial sky continuum emission | Spatial sky telluric CO2 absorption deviations (filled: H < 10) | |||||||||||||||||||||||
| 0 | 0 |
|
|
|
|
|
|
| IPAIR | NAME | SHIFT | NEWSHIFT | S/N | NAME | SHIFT | NEWSHIFT | S/N |
| 0 | 10450034 | 0.509014 | 0.00000 | 19.0838 | 10450036 | 0.00428668 | 0.504727 | 19.0352 |
| 1 | 10450038 | 0.504080 | 0.00493401 | 19.1109 | 10450040 | 0.00236670 | 0.506647 | 19.1640 |
| 2 | 10450039 | 0.504742 | 0.00427198 | 19.1006 | 10450033 | 0.00000 | 0.509014 | 19.0487 |
| 3 | 10450035 | 0.508775 | 0.000239015 | 19.0442 | 10450037 | 0.00444459 | 0.504569 | 19.0088 |