| Red | Green | Blue | |
| z | 17.64 | ||
| znorm | Inf | ||
| sky | -Inf | -Inf | -Inf |
| S/N | 25.4 | 42.1 | 46.0 |
| S/N(c) | 0.0 | 0.0 | 0.0 |
| SN(E/C) |
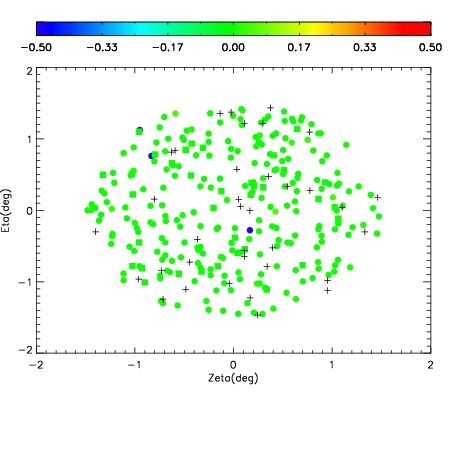
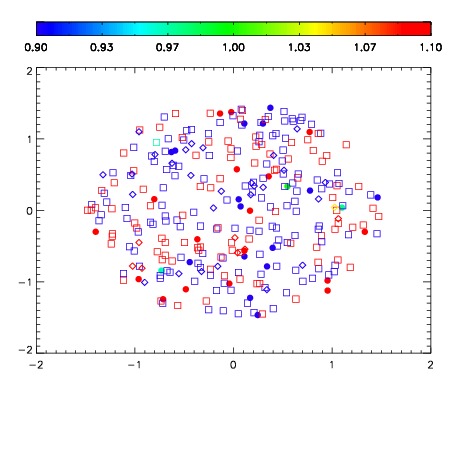
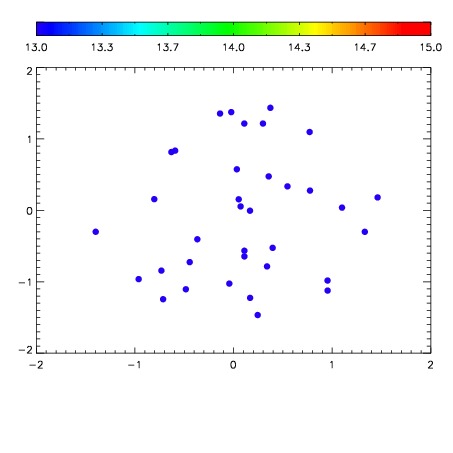

| Frame | Nreads | Zeropoints | Mag plots | Spatial mag deviation | Spatial sky 16325A emission deviations (filled: sky, open: star) | Spatial sky continuum emission | Spatial sky telluric CO2 absorption deviations (filled: H < 10) | |||||||||||||||||||||||
| 0 | 0 |
|
|
|
|
|
|
| IPAIR | NAME | SHIFT | NEWSHIFT | S/N | NAME | SHIFT | NEWSHIFT | S/N |
| 0 | 10540039 | 0.500732 | 0.00000 | 19.0131 | 10540037 | 0.00000 | 0.500732 | 19.0061 |
| 1 | 10540042 | 0.499301 | 0.00143102 | 19.0888 | 10540041 | 0.000870744 | 0.499861 | 19.1142 |
| 2 | 10540038 | 0.500411 | 0.000321031 | 19.0399 | 10540040 | 0.00132400 | 0.499408 | 19.0616 |
| 3 | 10540043 | 0.500015 | 0.000716984 | 18.9735 | 10540044 | 0.00253473 | 0.498197 | 18.8492 |