| Red | Green | Blue | |
| z | 17.64 | ||
| znorm | Inf | ||
| sky | -Inf | -Inf | -Inf |
| S/N | 28.7 | 48.2 | 51.7 |
| S/N(c) | 0.0 | 0.0 | 0.0 |
| SN(E/C) |
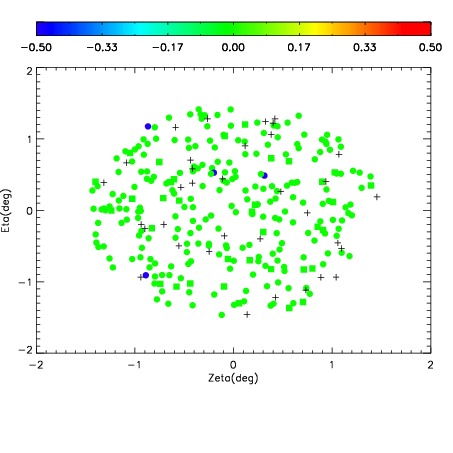

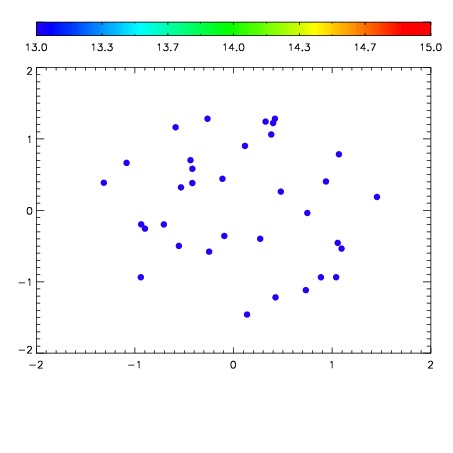

| Frame | Nreads | Zeropoints | Mag plots | Spatial mag deviation | Spatial sky 16325A emission deviations (filled: sky, open: star) | Spatial sky continuum emission | Spatial sky telluric CO2 absorption deviations (filled: H < 10) | |||||||||||||||||||||||
| 0 | 0 |
|
|
|
|
|
|
| IPAIR | NAME | SHIFT | NEWSHIFT | S/N | NAME | SHIFT | NEWSHIFT | S/N |
| 0 | 10230054 | 0.502783 | 0.00000 | 19.1521 | 10230053 | 0.000747486 | 0.502035 | 19.1095 |
| 1 | 10230055 | 0.502752 | 3.09944e-05 | 19.1552 | 10230056 | 0.000604977 | 0.502178 | 19.1547 |
| 2 | 10230051 | 0.500361 | 0.00242198 | 19.1305 | 10230052 | 0.00102721 | 0.501756 | 19.0873 |
| 3 | 10230050 | 0.500621 | 0.00216198 | 19.1261 | 10230049 | 0.00000 | 0.502783 | 19.0786 |