| Red | Green | Blue | |
| z | 17.64 | ||
| znorm | Inf | ||
| sky | -Inf | -NaN | -Inf |
| S/N | 16.8 | 29.3 | 30.6 |
| S/N(c) | 0.0 | 0.0 | 0.0 |
| SN(E/C) |
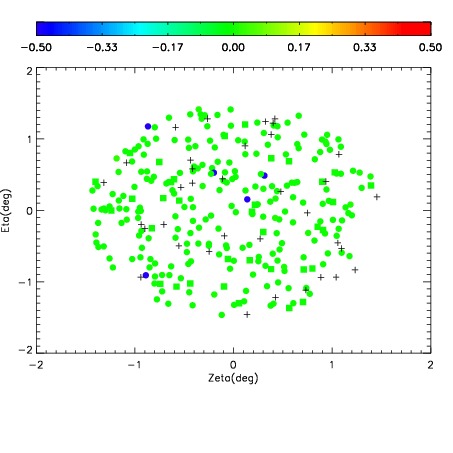

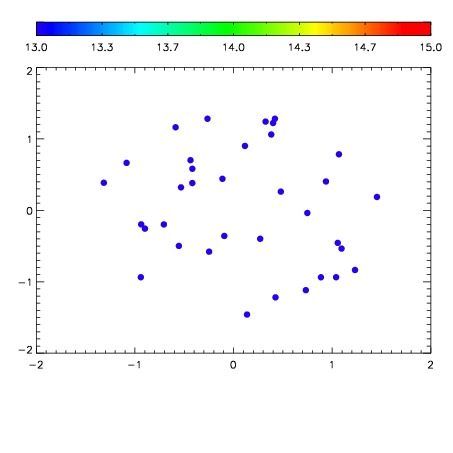

| Frame | Nreads | Zeropoints | Mag plots | Spatial mag deviation | Spatial sky 16325A emission deviations (filled: sky, open: star) | Spatial sky continuum emission | Spatial sky telluric CO2 absorption deviations (filled: H < 10) | |||||||||||||||||||||||
| 0 | 0 |
|
|
|
|
|
|
| IPAIR | NAME | SHIFT | NEWSHIFT | S/N | NAME | SHIFT | NEWSHIFT | S/N |
| 0 | 10270046 | 0.496165 | 0.00000 | 15.0280 | 10270047 | 0.000343376 | 0.495822 | 16.7843 |
| 1 | 10270050 | 0.494583 | 0.00158200 | 19.0008 | 10270051 | 0.000853156 | 0.495312 | 19.1002 |
| 2 | 10270049 | 0.494021 | 0.00214401 | 18.8517 | 10270048 | -0.000674168 | 0.496839 | 18.0883 |
| 3 | 10270045 | 0.496154 | 1.09971e-05 | 15.6726 | 10270044 | 0.00000 | 0.496165 | 16.8130 |