| Red | Green | Blue | |
| z | 17.64 | ||
| znorm | Inf | ||
| sky | -NaN | -NaN | -NaN |
| S/N | 26.3 | 45.2 | 45.9 |
| S/N(c) | 0.0 | 0.0 | 0.0 |
| SN(E/C) |
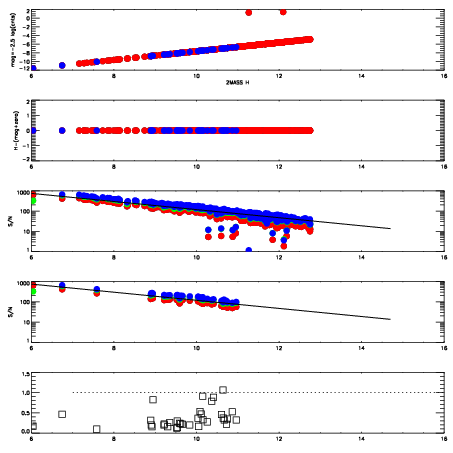
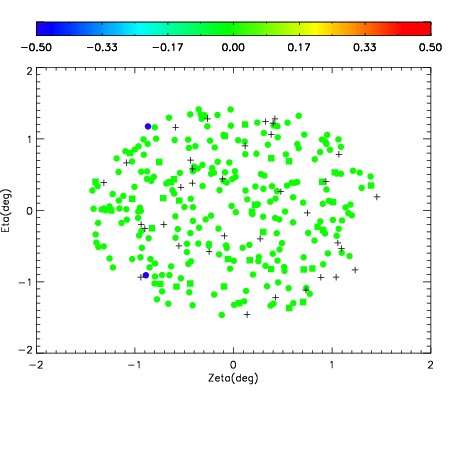
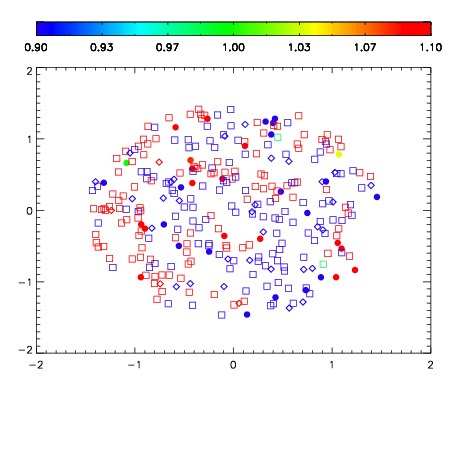
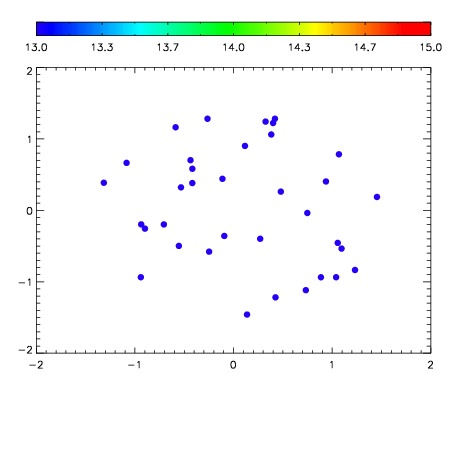

| Frame | Nreads | Zeropoints | Mag plots | Spatial mag deviation | Spatial sky 16325A emission deviations (filled: sky, open: star) | Spatial sky continuum emission | Spatial sky telluric CO2 absorption deviations (filled: H < 10) | |||||||||||||||||||||||
| 0 | 0 |
|
|
|
|
|
|
| IPAIR | NAME | SHIFT | NEWSHIFT | S/N | NAME | SHIFT | NEWSHIFT | S/N |
| 0 | 10520024 | 0.506109 | 0.00000 | 18.9758 | 10520027 | 0.00955306 | 0.496556 | 18.8879 |
| 1 | 10520029 | 0.505663 | 0.000446022 | 19.0972 | 10520030 | 0.0297819 | 0.476327 | 19.0639 |
| 2 | 10520028 | 0.505480 | 0.000629008 | 19.0796 | 10520023 | 0.00000 | 0.506109 | 19.0450 |
| 3 | 10520025 | 0.505210 | 0.000899017 | 19.0519 | 10520026 | 0.00911741 | 0.496992 | 18.9913 |