| Red | Green | Blue | |
| z | 17.64 | ||
| znorm | Inf | ||
| sky | -Inf | -Inf | -Inf |
| S/N | 19.3 | 35.3 | 37.6 |
| S/N(c) | 0.0 | 0.0 | 0.0 |
| SN(E/C) |
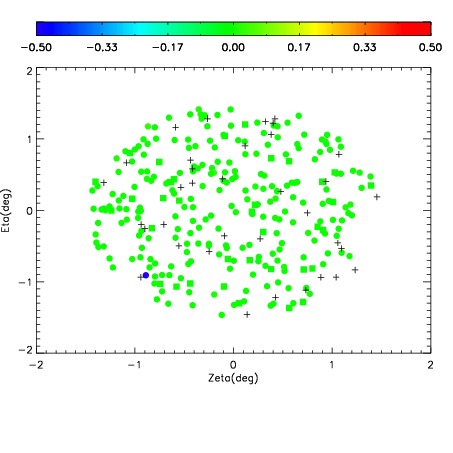
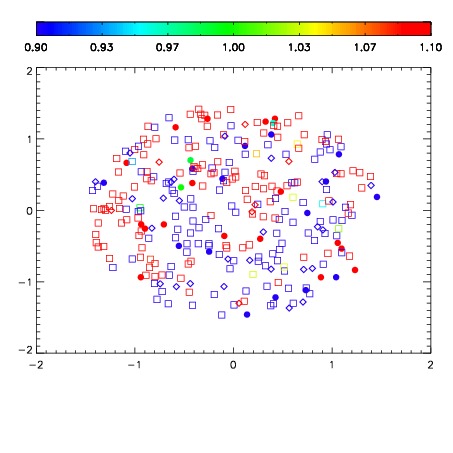
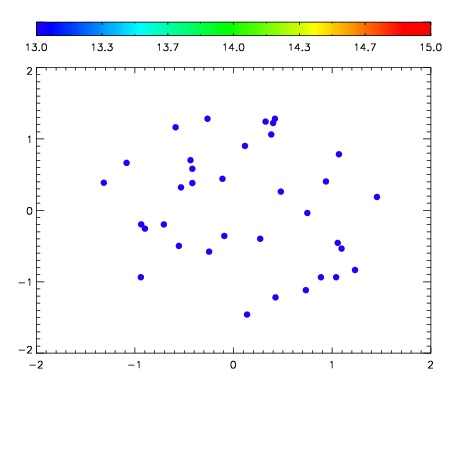

| Frame | Nreads | Zeropoints | Mag plots | Spatial mag deviation | Spatial sky 16325A emission deviations (filled: sky, open: star) | Spatial sky continuum emission | Spatial sky telluric CO2 absorption deviations (filled: H < 10) | |||||||||||||||||||||||
| 0 | 0 |
|
|
|
|
|
|
| IPAIR | NAME | SHIFT | NEWSHIFT | S/N | NAME | SHIFT | NEWSHIFT | S/N |
| 0 | 10800017 | 0.490397 | 0.00000 | 18.6810 | 10800015 | -0.00244753 | 0.492845 | 18.6294 |
| 1 | 10800016 | 0.489794 | 0.000603020 | 18.7516 | 10800018 | -0.000620663 | 0.491018 | 18.8146 |
| 2 | 10800013 | 0.490342 | 5.50151e-05 | 18.5816 | 10800011 | 0.00000 | 0.490397 | 18.5021 |
| 3 | 10800012 | 0.489365 | 0.00103199 | 18.4268 | 10800014 | -0.00271206 | 0.493109 | 18.4681 |