| Red | Green | Blue | |
| z | 17.64 | ||
| znorm | Inf | ||
| sky | -NaN | -NaN | -Inf |
| S/N | 26.1 | 45.0 | 48.9 |
| S/N(c) | 0.0 | 0.0 | 0.0 |
| SN(E/C) |


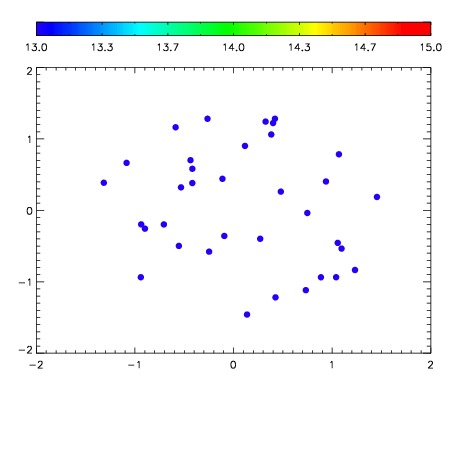

| Frame | Nreads | Zeropoints | Mag plots | Spatial mag deviation | Spatial sky 16325A emission deviations (filled: sky, open: star) | Spatial sky continuum emission | Spatial sky telluric CO2 absorption deviations (filled: H < 10) | |||||||||||||||||||||||
| 0 | 0 |
|
|
|
|
|
|
| IPAIR | NAME | SHIFT | NEWSHIFT | S/N | NAME | SHIFT | NEWSHIFT | S/N |
| 0 | 10820020 | 0.485274 | 0.00000 | 19.0678 | 10820011 | 0.00000 | 0.485274 | 19.0342 |
| 1 | 10820012 | 0.482230 | 0.00304398 | 18.9242 | 10820018 | -0.000234221 | 0.485508 | 18.9403 |
| 2 | 10820017 | 0.484755 | 0.000518978 | 18.8224 | 10820019 | -4.38866e-05 | 0.485318 | 18.9034 |
| 3 | 10820013 | 0.482866 | 0.00240800 | 18.5794 | 10820014 | -0.00172023 | 0.486994 | 18.6977 |
| 4 | 10820016 | 0.484552 | 0.000721991 | 18.5089 | 10820015 | -0.00176584 | 0.487040 | 18.6092 |