| Red | Green | Blue | |
| z | 17.64 | ||
| znorm | Inf | ||
| sky | -NaN | -NaN | -Inf |
| S/N | 26.8 | 43.4 | 47.3 |
| S/N(c) | 0.0 | 0.0 | 0.0 |
| SN(E/C) |


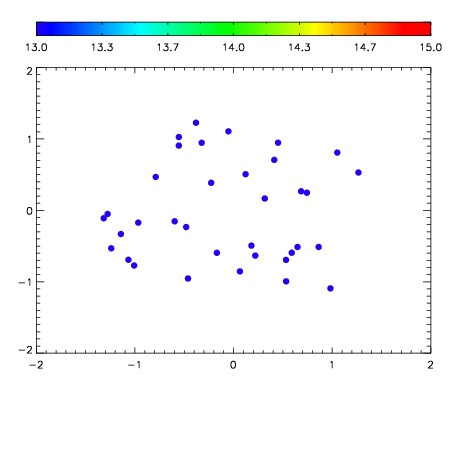

| Frame | Nreads | Zeropoints | Mag plots | Spatial mag deviation | Spatial sky 16325A emission deviations (filled: sky, open: star) | Spatial sky continuum emission | Spatial sky telluric CO2 absorption deviations (filled: H < 10) | |||||||||||||||||||||||
| 0 | 0 |
|
|
|
|
|
|
| IPAIR | NAME | SHIFT | NEWSHIFT | S/N | NAME | SHIFT | NEWSHIFT | S/N |
| 0 | 10200053 | 0.490318 | 0.00000 | 18.9870 | 10200048 | 0.00000 | 0.490318 | 18.9368 |
| 1 | 10200050 | 0.490012 | 0.000306010 | 19.0562 | 10200055 | -0.00189699 | 0.492215 | 19.1426 |
| 2 | 10200054 | 0.490296 | 2.19941e-05 | 19.0368 | 10200051 | 0.00179566 | 0.488522 | 19.0803 |
| 3 | 10200049 | 0.489698 | 0.000620008 | 19.0294 | 10200052 | 0.00171500 | 0.488603 | 19.0667 |