| Red | Green | Blue | |
| z | 17.64 | ||
| znorm | Inf | ||
| sky | -NaN | -NaN | -Inf |
| S/N | 27.8 | 46.2 | 48.4 |
| S/N(c) | 0.0 | 0.0 | 0.0 |
| SN(E/C) |
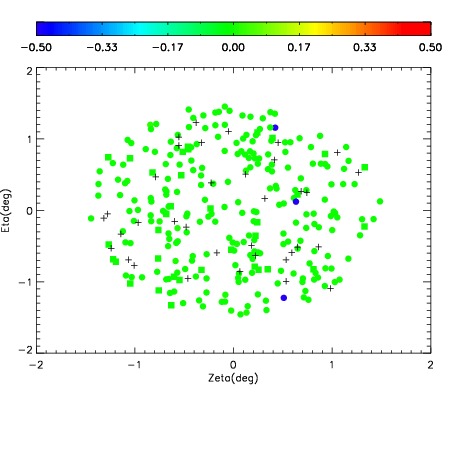


| Frame | Nreads | Zeropoints | Mag plots | Spatial mag deviation | Spatial sky 16325A emission deviations (filled: sky, open: star) | Spatial sky continuum emission | Spatial sky telluric CO2 absorption deviations (filled: H < 10) | |||||||||||||||||||||||
| 0 | 0 |
|
|
|
|
|
|
| IPAIR | NAME | SHIFT | NEWSHIFT | S/N | NAME | SHIFT | NEWSHIFT | S/N |
| 0 | 10240049 | 0.502617 | 0.00000 | 19.0769 | 10240055 | 0.00338704 | 0.499230 | 19.0570 |
| 1 | 10240054 | 0.498102 | 0.00451499 | 19.0919 | 10240052 | 0.00105482 | 0.501562 | 19.0979 |
| 2 | 10240053 | 0.497653 | 0.00496399 | 19.0900 | 10240051 | 0.00134014 | 0.501277 | 19.0974 |
| 3 | 10240050 | 0.502238 | 0.000379026 | 19.0714 | 10240048 | 0.00000 | 0.502617 | 19.0457 |