| Red | Green | Blue | |
| z | 17.64 | ||
| znorm | Inf | ||
| sky | -Inf | -Inf | -Inf |
| S/N | 27.1 | 45.2 | 46.6 |
| S/N(c) | 0.0 | 0.0 | 0.0 |
| SN(E/C) |
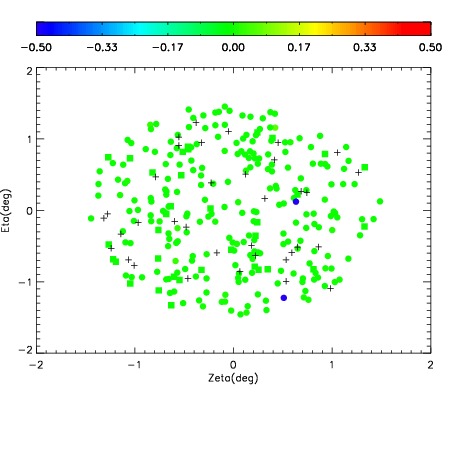


| Frame | Nreads | Zeropoints | Mag plots | Spatial mag deviation | Spatial sky 16325A emission deviations (filled: sky, open: star) | Spatial sky continuum emission | Spatial sky telluric CO2 absorption deviations (filled: H < 10) | |||||||||||||||||||||||
| 0 | 0 |
|
|
|
|
|
|
| IPAIR | NAME | SHIFT | NEWSHIFT | S/N | NAME | SHIFT | NEWSHIFT | S/N |
| 0 | 10460039 | 0.500902 | 0.00000 | 19.0727 | 10460037 | 0.00000 | 0.500902 | 19.0533 |
| 1 | 10460042 | 0.499100 | 0.00180200 | 19.0512 | 10460041 | 0.00200524 | 0.498897 | 19.0314 |
| 2 | 10460043 | 0.499785 | 0.00111699 | 19.0318 | 10460040 | 0.00246474 | 0.498437 | 19.0107 |
| 3 | 10460038 | 0.500568 | 0.000334024 | 19.0293 | 10460044 | 0.00341392 | 0.497488 | 18.9682 |