| Red | Green | Blue | |
| z | 17.64 | ||
| znorm | Inf | ||
| sky | -Inf | -Inf | -Inf |
| S/N | 27.0 | 46.5 | 48.5 |
| S/N(c) | 0.0 | 0.0 | 0.0 |
| SN(E/C) |
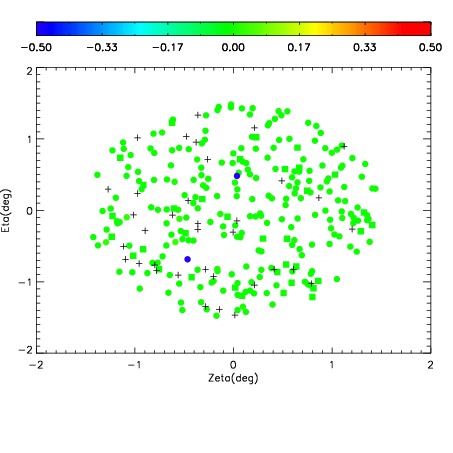
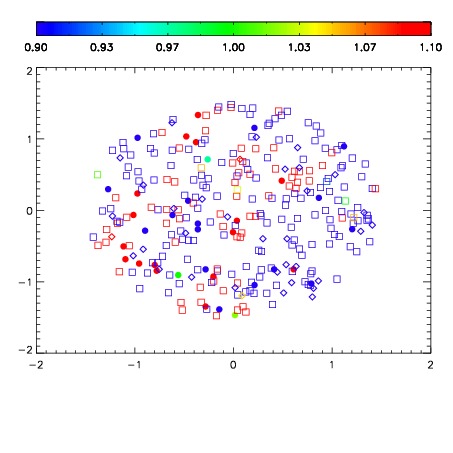
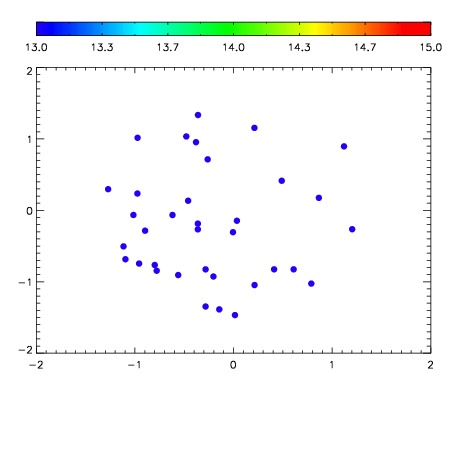

| Frame | Nreads | Zeropoints | Mag plots | Spatial mag deviation | Spatial sky 16325A emission deviations (filled: sky, open: star) | Spatial sky continuum emission | Spatial sky telluric CO2 absorption deviations (filled: H < 10) | |||||||||||||||||||||||
| 0 | 0 |
|
|
|
|
|
|
| IPAIR | NAME | SHIFT | NEWSHIFT | S/N | NAME | SHIFT | NEWSHIFT | S/N |
| 0 | 10460050 | 0.498205 | 0.00000 | 18.9863 | 10460051 | 0.00290705 | 0.495298 | 18.9680 |
| 1 | 10460053 | 0.497613 | 0.000591993 | 18.9971 | 10460055 | -0.00138021 | 0.499585 | 19.0260 |
| 2 | 10460054 | 0.498183 | 2.19941e-05 | 18.9914 | 10460052 | 0.00259477 | 0.495610 | 18.9947 |
| 3 | 10460049 | 0.498035 | 0.000169992 | 18.9647 | 10460048 | 0.00000 | 0.498205 | 18.9602 |