| Red | Green | Blue | |
| z | 17.64 | ||
| znorm | Inf | ||
| sky | -Inf | -Inf | -Inf |
| S/N | 25.6 | 43.9 | 46.3 |
| S/N(c) | 0.0 | 0.0 | 0.0 |
| SN(E/C) |
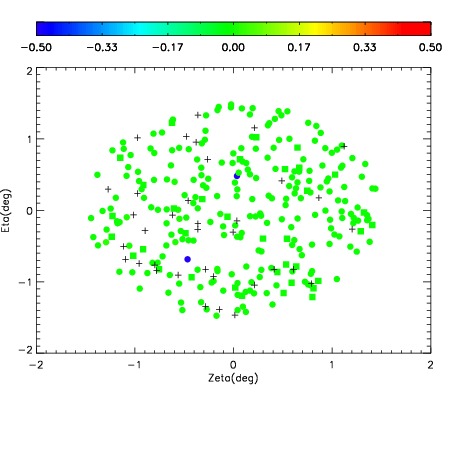
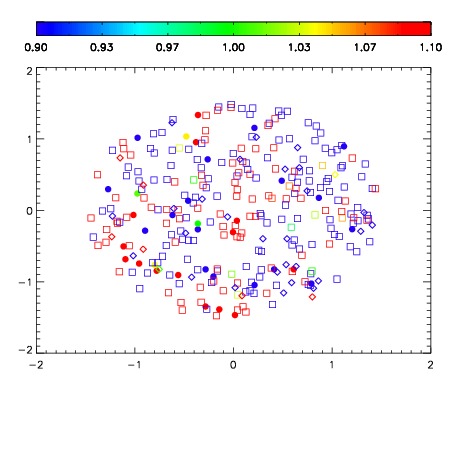
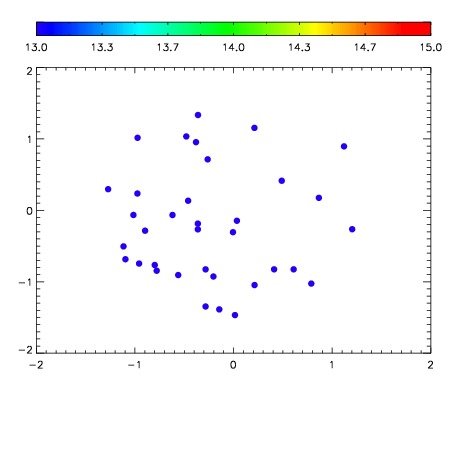

| Frame | Nreads | Zeropoints | Mag plots | Spatial mag deviation | Spatial sky 16325A emission deviations (filled: sky, open: star) | Spatial sky continuum emission | Spatial sky telluric CO2 absorption deviations (filled: H < 10) | |||||||||||||||||||||||
| 0 | 0 |
|
|
|
|
|
|
| IPAIR | NAME | SHIFT | NEWSHIFT | S/N | NAME | SHIFT | NEWSHIFT | S/N |
| 0 | 10750039 | 0.490645 | 0.00000 | 18.9995 | 10750040 | -0.000428232 | 0.491073 | 19.0269 |
| 1 | 10750042 | 0.489698 | 0.000946999 | 19.0319 | 10750041 | 0.000120643 | 0.490524 | 19.1075 |
| 2 | 10750043 | 0.489394 | 0.00125098 | 18.9962 | 10750044 | -0.00211146 | 0.492756 | 18.9390 |
| 3 | 10750038 | 0.490413 | 0.000231981 | 18.9010 | 10750037 | 0.00000 | 0.490645 | 18.9324 |