| Red | Green | Blue | |
| z | 17.64 | ||
| znorm | Inf | ||
| sky | -Inf | -Inf | -Inf |
| S/N | 23.9 | 40.9 | 43.3 |
| S/N(c) | 0.0 | 0.0 | 0.0 |
| SN(E/C) |
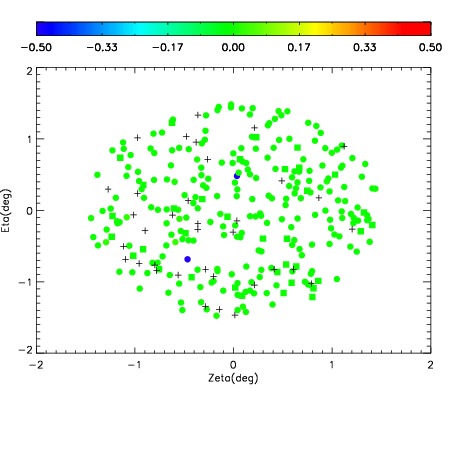
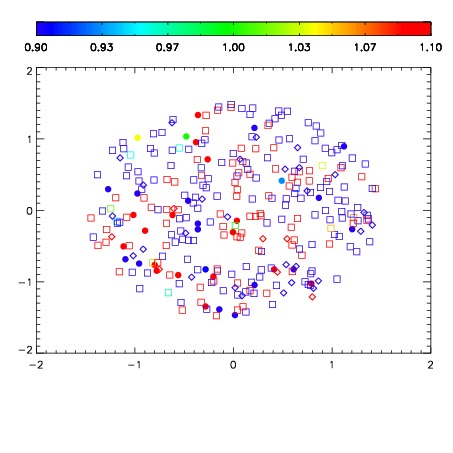


| Frame | Nreads | Zeropoints | Mag plots | Spatial mag deviation | Spatial sky 16325A emission deviations (filled: sky, open: star) | Spatial sky continuum emission | Spatial sky telluric CO2 absorption deviations (filled: H < 10) | |||||||||||||||||||||||
| 0 | 0 |
|
|
|
|
|
|
| IPAIR | NAME | SHIFT | NEWSHIFT | S/N | NAME | SHIFT | NEWSHIFT | S/N |
| 0 | 10800032 | 0.489833 | 0.00000 | 18.9846 | 10800033 | -0.000607305 | 0.490440 | 18.9364 |
| 1 | 10800031 | 0.489612 | 0.000220984 | 18.9400 | 10800030 | 0.000326730 | 0.489506 | 18.8910 |
| 2 | 10800027 | 0.489069 | 0.000763983 | 18.7629 | 10800026 | 0.00000 | 0.489833 | 18.8765 |
| 3 | 10800028 | 0.488988 | 0.000844985 | 18.7104 | 10800029 | -0.000702049 | 0.490535 | 18.7477 |