| Red | Green | Blue | |
| z | 17.64 | ||
| znorm | Inf | ||
| sky | -Inf | -Inf | -Inf |
| S/N | 23.8 | 41.2 | 42.5 |
| S/N(c) | 0.0 | 0.0 | 0.0 |
| SN(E/C) |
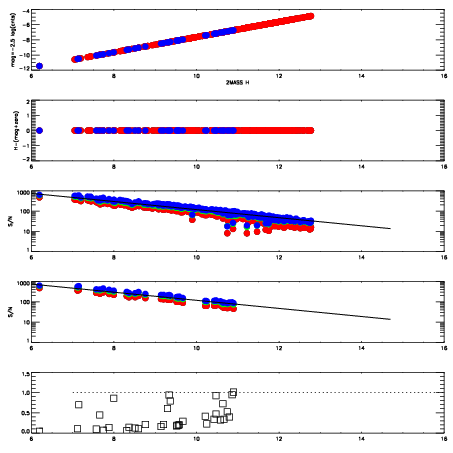
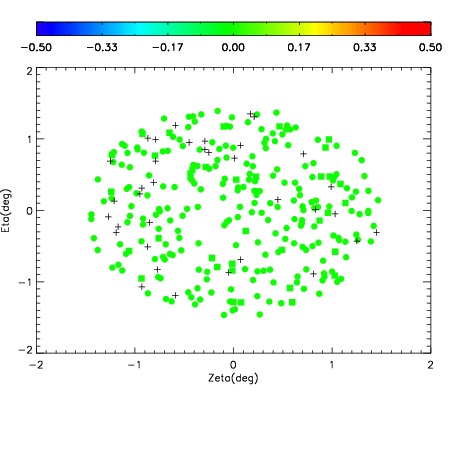
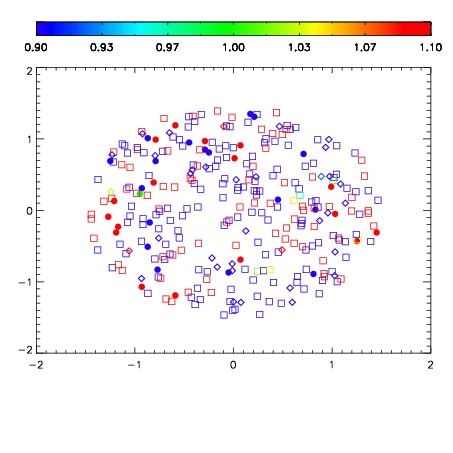
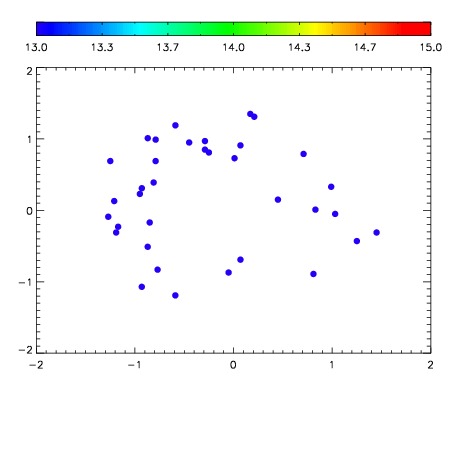

| Frame | Nreads | Zeropoints | Mag plots | Spatial mag deviation | Spatial sky 16325A emission deviations (filled: sky, open: star) | Spatial sky continuum emission | Spatial sky telluric CO2 absorption deviations (filled: H < 10) | |||||||||||||||||||||||
| 0 | 0 |
|
|
|
|
|
|
| IPAIR | NAME | SHIFT | NEWSHIFT | S/N | NAME | SHIFT | NEWSHIFT | S/N |
| 0 | 10490056 | 0.497200 | 0.00000 | 18.6864 | 10490050 | 0.00000 | 0.497200 | 18.7035 |
| 1 | 10490051 | 0.496634 | 0.000566006 | 18.8098 | 10490054 | 0.00175026 | 0.495450 | 18.8871 |
| 2 | 10490055 | 0.496763 | 0.000437021 | 18.7737 | 10490053 | 0.00176585 | 0.495434 | 18.7873 |
| 3 | 10490052 | 0.496831 | 0.000369012 | 18.7157 | 10490057 | -0.000271888 | 0.497472 | 18.7699 |