| Red | Green | Blue | |
| z | 17.64 | ||
| znorm | Inf | ||
| sky | -Inf | -Inf | -Inf |
| S/N | 6.0 | 11.3 | 12.8 |
| S/N(c) | 0.0 | 0.0 | 0.0 |
| SN(E/C) |
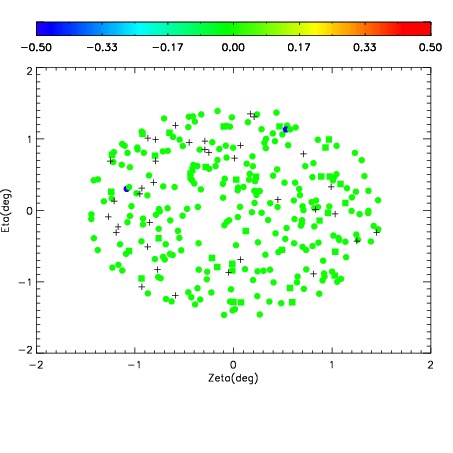
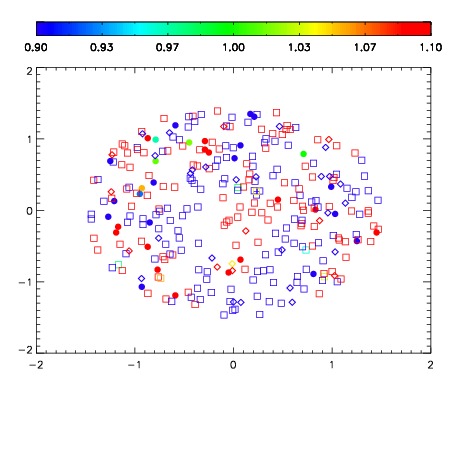
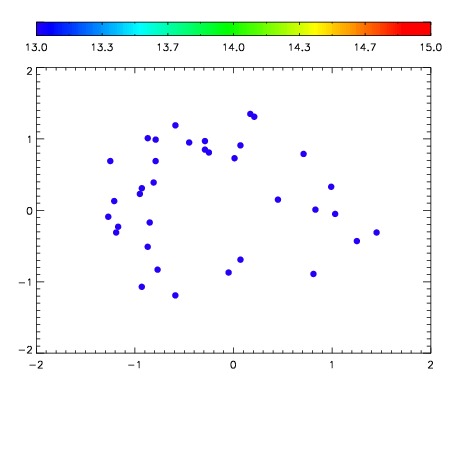

| Frame | Nreads | Zeropoints | Mag plots | Spatial mag deviation | Spatial sky 16325A emission deviations (filled: sky, open: star) | Spatial sky continuum emission | Spatial sky telluric CO2 absorption deviations (filled: H < 10) | |||||||||||||||||||||||
| 0 | 0 |
|
|
|
|
|
|
| IPAIR | NAME | SHIFT | NEWSHIFT | S/N | NAME | SHIFT | NEWSHIFT | S/N |
| 0 | 10540049 | 0.501212 | 0.00000 | 17.4504 | 10540055 | 0.00295408 | 0.498258 | 17.1902 |
| 1 | 10540053 | 0.499851 | 0.00136101 | 17.6652 | 10540052 | 0.00716197 | 0.494050 | 17.5396 |
| 2 | 10540050 | 0.500973 | 0.000239015 | 17.3090 | 10540048 | 0.00000 | 0.501212 | 17.0592 |
| 3 | 10540054 | 0.500569 | 0.000643015 | 16.5280 | 10540051 | 0.00747148 | 0.493741 | 16.7681 |