| Red | Green | Blue | |
| z | 17.64 | ||
| znorm | Inf | ||
| sky | -Inf | -Inf | -Inf |
| S/N | 24.7 | 40.8 | 44.0 |
| S/N(c) | 0.0 | 0.0 | 0.0 |
| SN(E/C) |


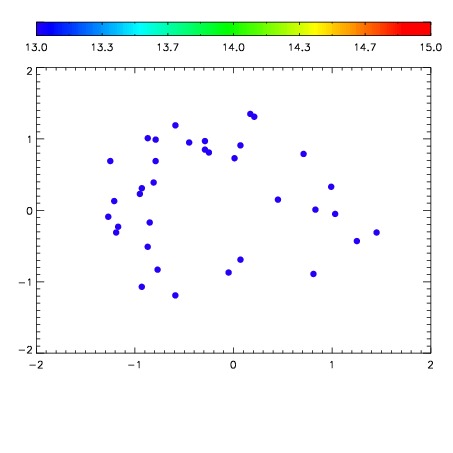

| Frame | Nreads | Zeropoints | Mag plots | Spatial mag deviation | Spatial sky 16325A emission deviations (filled: sky, open: star) | Spatial sky continuum emission | Spatial sky telluric CO2 absorption deviations (filled: H < 10) | |||||||||||||||||||||||
| 0 | 0 |
|
|
|
|
|
|
| IPAIR | NAME | SHIFT | NEWSHIFT | S/N | NAME | SHIFT | NEWSHIFT | S/N |
| 0 | 10790042 | 0.495738 | 0.00000 | 18.9937 | 10790036 | 0.00000 | 0.495738 | 18.9296 |
| 1 | 10790038 | 0.495327 | 0.000411004 | 18.9843 | 10790043 | -0.00188399 | 0.497622 | 18.9007 |
| 2 | 10790037 | 0.494854 | 0.000883996 | 18.9669 | 10790039 | -0.00140931 | 0.497147 | 18.8290 |
| 3 | 10790041 | 0.495622 | 0.000115991 | 18.8118 | 10790040 | -0.00142281 | 0.497161 | 18.7575 |