| Red | Green | Blue | |
| z | 17.64 | ||
| znorm | Inf | ||
| sky | -Inf | -Inf | -Inf |
| S/N | 23.4 | 43.3 | 44.1 |
| S/N(c) | 0.0 | 0.0 | 0.0 |
| SN(E/C) |


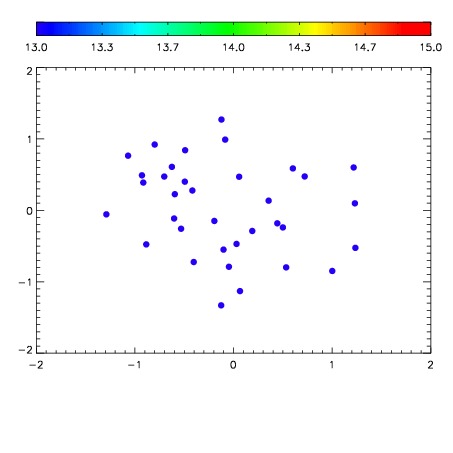

| Frame | Nreads | Zeropoints | Mag plots | Spatial mag deviation | Spatial sky 16325A emission deviations (filled: sky, open: star) | Spatial sky continuum emission | Spatial sky telluric CO2 absorption deviations (filled: H < 10) | |||||||||||||||||||||||
| 0 | 0 |
|
|
|
|
|
|
| IPAIR | NAME | SHIFT | NEWSHIFT | S/N | NAME | SHIFT | NEWSHIFT | S/N |
| 0 | 07870044 | 0.458506 | 0.00000 | 18.9386 | 07870045 | -0.00264157 | 0.461148 | 18.9235 |
| 1 | 07870043 | 0.458483 | 2.29776e-05 | 18.9455 | 07870042 | 0.00000 | 0.458506 | 18.9243 |
| 2 | 07870048 | 0.458400 | 0.000105977 | 18.8217 | 07870046 | -0.00312849 | 0.461634 | 18.8570 |
| 3 | 07870047 | 0.458442 | 6.39856e-05 | 18.7178 | 07870049 | -0.00349405 | 0.462000 | 18.7990 |