| Red | Green | Blue | |
| z | 17.64 | ||
| znorm | Inf | ||
| sky | -Inf | -Inf | -NaN |
| S/N | 25.9 | 47.6 | 50.2 |
| S/N(c) | 0.0 | 0.0 | 0.0 |
| SN(E/C) |
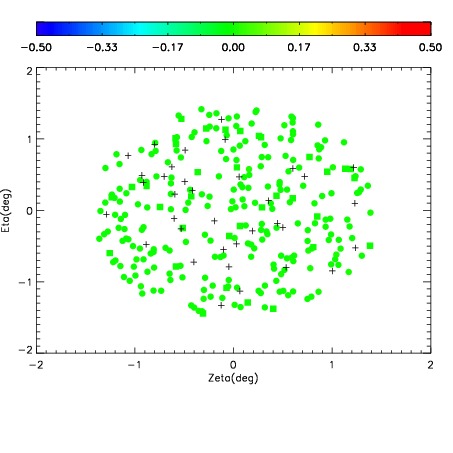

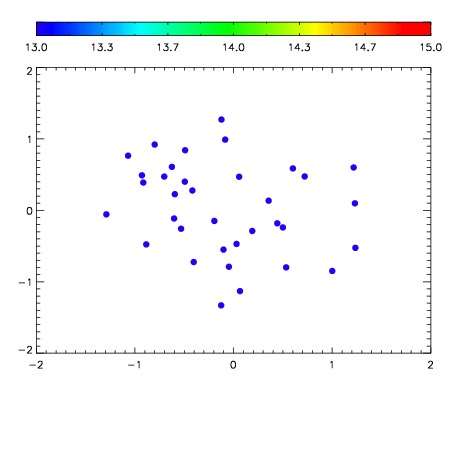

| Frame | Nreads | Zeropoints | Mag plots | Spatial mag deviation | Spatial sky 16325A emission deviations (filled: sky, open: star) | Spatial sky continuum emission | Spatial sky telluric CO2 absorption deviations (filled: H < 10) | |||||||||||||||||||||||
| 0 | 0 |
|
|
|
|
|
|
| IPAIR | NAME | SHIFT | NEWSHIFT | S/N | NAME | SHIFT | NEWSHIFT | S/N |
| 0 | 10780040 | 0.494943 | 0.00000 | 18.3524 | 10780041 | 0.00179473 | 0.493148 | 18.3184 |
| 1 | 10780027 | 0.491698 | 0.00324500 | 18.6658 | 10780026 | 0.00000 | 0.494943 | 18.7191 |
| 2 | 10780035 | 0.489964 | 0.00497898 | 18.5358 | 10780033 | -0.000288124 | 0.495231 | 18.5077 |
| 3 | 10780028 | 0.492837 | 0.00210598 | 18.5327 | 10780030 | 0.000496668 | 0.494446 | 18.4870 |
| 4 | 10780032 | 0.490729 | 0.00421399 | 18.5218 | 10780034 | -0.000788663 | 0.495732 | 18.4225 |
| 5 | 10780031 | 0.490472 | 0.00447100 | 18.5209 | 10780029 | 0.000451231 | 0.494492 | 18.4008 |
| 6 | 10780036 | 0.491019 | 0.00392398 | 18.5150 | 10780038 | 0.00249616 | 0.492447 | 18.3635 |
| 7 | 10780039 | 0.492776 | 0.00216699 | 18.4239 | 10780037 | 0.00194023 | 0.493003 | 18.3539 |