| Red | Green | Blue | |
| z | 17.64 | ||
| znorm | Inf | ||
| sky | -Inf | -NaN | -Inf |
| S/N | 21.8 | 36.5 | 38.8 |
| S/N(c) | 0.0 | 0.0 | 0.0 |
| SN(E/C) |

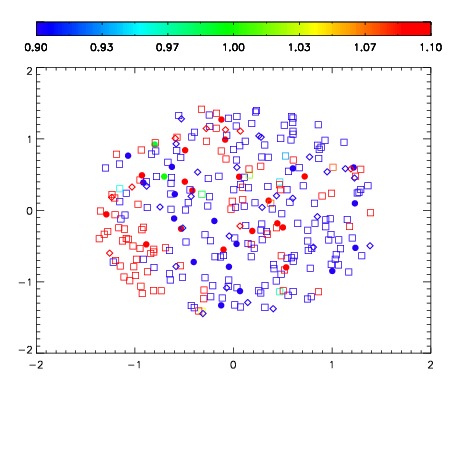
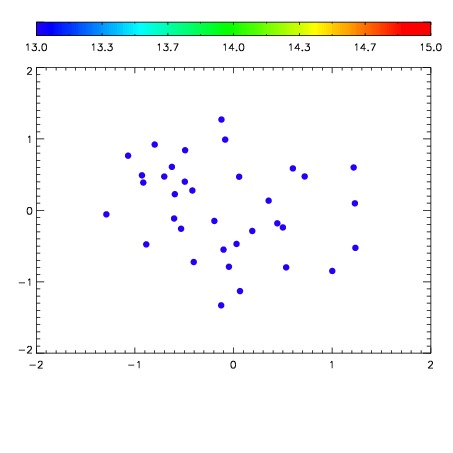

| Frame | Nreads | Zeropoints | Mag plots | Spatial mag deviation | Spatial sky 16325A emission deviations (filled: sky, open: star) | Spatial sky continuum emission | Spatial sky telluric CO2 absorption deviations (filled: H < 10) | |||||||||||||||||||||||
| 0 | 0 |
|
|
|
|
|
|
| IPAIR | NAME | SHIFT | NEWSHIFT | S/N | NAME | SHIFT | NEWSHIFT | S/N |
| 0 | 10880086 | 0.503332 | 0.00000 | 18.5581 | 10880083 | -0.00149610 | 0.504828 | 18.4947 |
| 1 | 10880082 | 0.502065 | 0.00126702 | 18.7240 | 10880087 | -9.62240e-05 | 0.503428 | 18.6299 |
| 2 | 10880085 | 0.502931 | 0.000401020 | 18.6106 | 10880080 | 0.00000 | 0.503332 | 18.5869 |
| 3 | 10880081 | 0.503002 | 0.000330031 | 18.6004 | 10880084 | -0.00153151 | 0.504864 | 18.5650 |