| Red | Green | Blue | |
| z | 17.64 | ||
| znorm | Inf | ||
| sky | -Inf | -Inf | -Inf |
| S/N | 23.9 | 42.2 | 44.9 |
| S/N(c) | 0.0 | 0.0 | 0.0 |
| SN(E/C) |
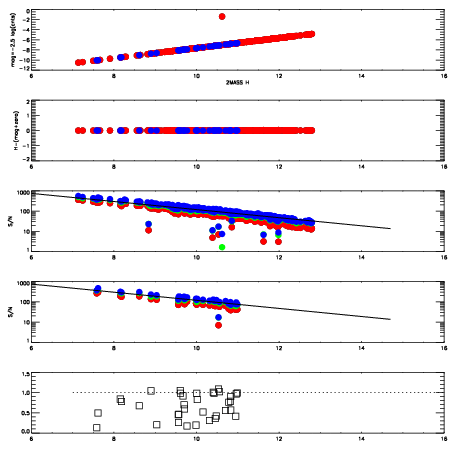
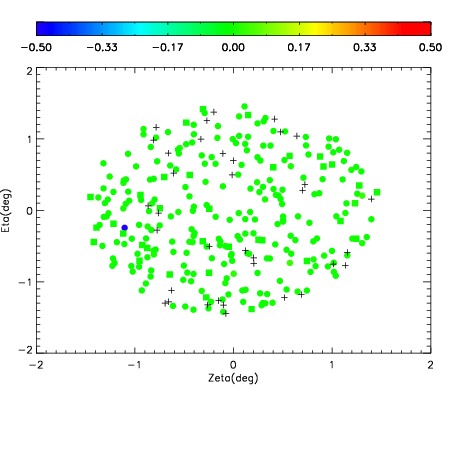
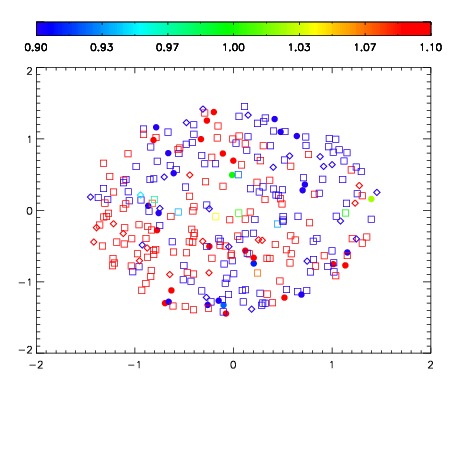
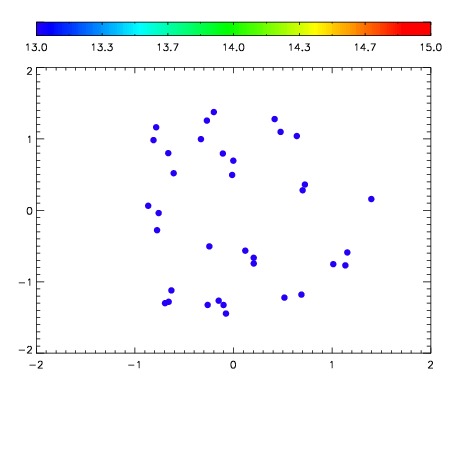

| Frame | Nreads | Zeropoints | Mag plots | Spatial mag deviation | Spatial sky 16325A emission deviations (filled: sky, open: star) | Spatial sky continuum emission | Spatial sky telluric CO2 absorption deviations (filled: H < 10) | |||||||||||||||||||||||
| 0 | 0 |
|
|
|
|
|
|
| IPAIR | NAME | SHIFT | NEWSHIFT | S/N | NAME | SHIFT | NEWSHIFT | S/N |
| 0 | 07020072 | 0.473065 | 0.00000 | 18.8043 | 07020074 | -0.00133109 | 0.474396 | 18.7388 |
| 1 | 07020076 | 0.470405 | 0.00265998 | 18.8434 | 07020077 | 0.000165512 | 0.472899 | 19.0029 |
| 2 | 07020075 | 0.470100 | 0.00296500 | 18.8399 | 07020070 | 0.00000 | 0.473065 | 18.9017 |
| 3 | 07020071 | 0.472138 | 0.000927001 | 18.7960 | 07020073 | 0.00332118 | 0.469744 | 18.7382 |