| Red | Green | Blue | |
| z | 17.64 | ||
| znorm | Inf | ||
| sky | -Inf | -Inf | -Inf |
| S/N | 24.9 | 43.1 | 47.1 |
| S/N(c) | 0.0 | 0.0 | 0.0 |
| SN(E/C) |
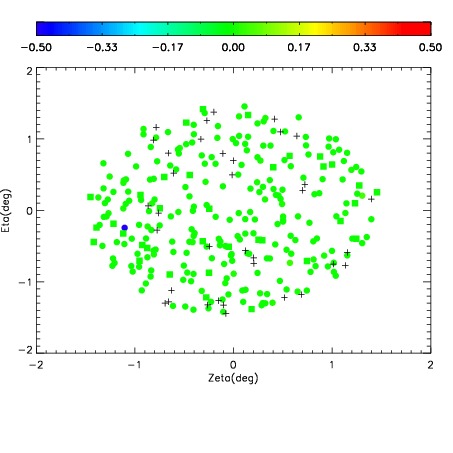
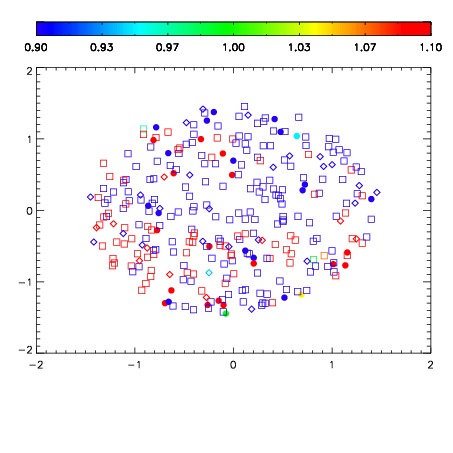


| Frame | Nreads | Zeropoints | Mag plots | Spatial mag deviation | Spatial sky 16325A emission deviations (filled: sky, open: star) | Spatial sky continuum emission | Spatial sky telluric CO2 absorption deviations (filled: H < 10) | |||||||||||||||||||||||
| 0 | 0 |
|
|
|
|
|
|
| IPAIR | NAME | SHIFT | NEWSHIFT | S/N | NAME | SHIFT | NEWSHIFT | S/N |
| 0 | 07830040 | 0.468584 | 0.00000 | 18.8225 | 07830038 | 0.00000 | 0.468584 | 18.7243 |
| 1 | 07830039 | 0.468426 | 0.000158012 | 18.9540 | 07830042 | 5.71279e-05 | 0.468527 | 18.9620 |
| 2 | 07830043 | 0.466957 | 0.00162700 | 18.9364 | 07830041 | 0.000367322 | 0.468217 | 18.9188 |
| 3 | 07830044 | 0.467544 | 0.00104001 | 18.8605 | 07830045 | -0.000287154 | 0.468871 | 18.7990 |