| Red | Green | Blue | |
| z | 17.64 | ||
| znorm | Inf | ||
| sky | -Inf | -Inf | -Inf |
| S/N | 24.2 | 43.5 | 46.4 |
| S/N(c) | 0.0 | 0.0 | 0.0 |
| SN(E/C) |
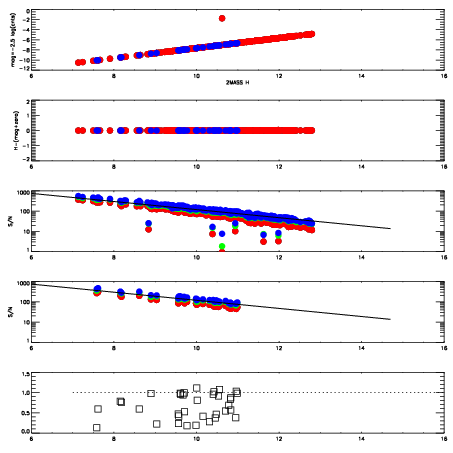


| Frame | Nreads | Zeropoints | Mag plots | Spatial mag deviation | Spatial sky 16325A emission deviations (filled: sky, open: star) | Spatial sky continuum emission | Spatial sky telluric CO2 absorption deviations (filled: H < 10) | |||||||||||||||||||||||
| 0 | 0 |
|
|
|
|
|
|
| IPAIR | NAME | SHIFT | NEWSHIFT | S/N | NAME | SHIFT | NEWSHIFT | S/N |
| 0 | 10810080 | 0.481793 | 0.00000 | 18.9547 | 10810077 | -0.000470228 | 0.482263 | 18.7458 |
| 1 | 10810075 | 0.480625 | 0.00116798 | 18.9639 | 10810074 | 0.00000 | 0.481793 | 18.8936 |
| 2 | 10810076 | 0.480538 | 0.00125498 | 18.9127 | 10810081 | -0.00137250 | 0.483165 | 18.6941 |
| 3 | 10810079 | 0.481578 | 0.000214994 | 18.8046 | 10810078 | -0.000513843 | 0.482307 | 18.6394 |