| Red | Green | Blue | |
| z | 17.64 | ||
| znorm | Inf | ||
| sky | -Inf | -Inf | -Inf |
| S/N | 28.2 | 47.9 | 53.3 |
| S/N(c) | 0.0 | 0.0 | 0.0 |
| SN(E/C) |
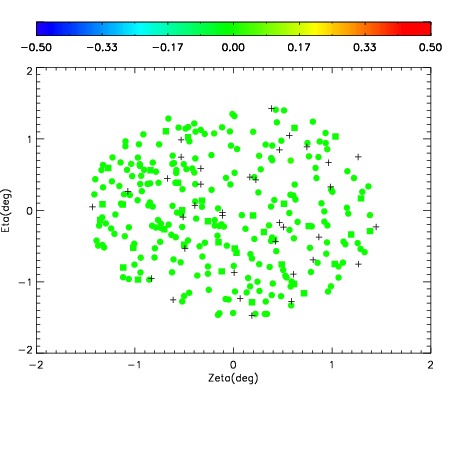
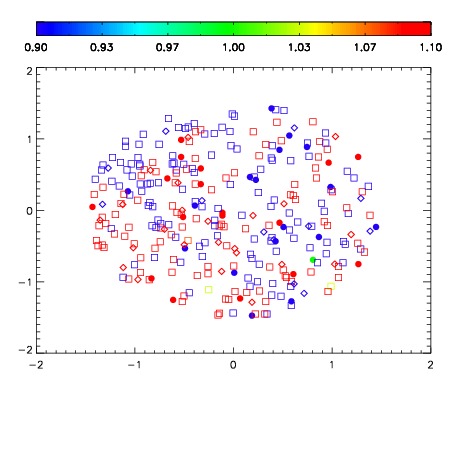
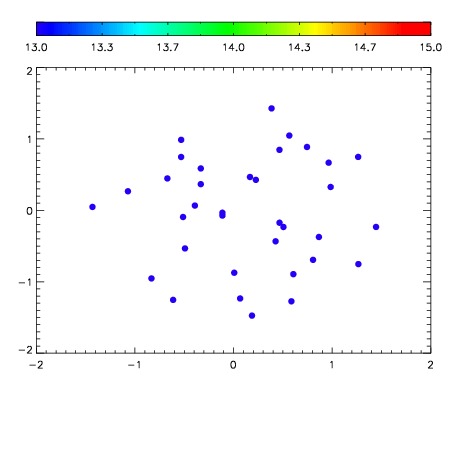

| Frame | Nreads | Zeropoints | Mag plots | Spatial mag deviation | Spatial sky 16325A emission deviations (filled: sky, open: star) | Spatial sky continuum emission | Spatial sky telluric CO2 absorption deviations (filled: H < 10) | |||||||||||||||||||||||
| 0 | 0 |
|
|
|
|
|
|
| IPAIR | NAME | SHIFT | NEWSHIFT | S/N | NAME | SHIFT | NEWSHIFT | S/N |
| 0 | 06980100 | 0.481943 | 0.00000 | 19.1761 | 06980101 | 0.00190533 | 0.480038 | 19.1923 |
| 1 | 06980099 | 0.480628 | 0.00131500 | 19.1756 | 06980102 | 0.000436747 | 0.481506 | 19.1574 |
| 2 | 06980103 | 0.479185 | 0.00275803 | 19.1362 | 06980105 | 0.000386490 | 0.481557 | 19.1167 |
| 3 | 06980104 | 0.480614 | 0.00132900 | 19.0843 | 06980098 | 0.00000 | 0.481943 | 19.0907 |