| Red | Green | Blue | |
| z | 17.64 | ||
| znorm | Inf | ||
| sky | -NaN | -Inf | -Inf |
| S/N | 31.1 | 51.9 | 57.9 |
| S/N(c) | 0.0 | 0.0 | 0.0 |
| SN(E/C) |

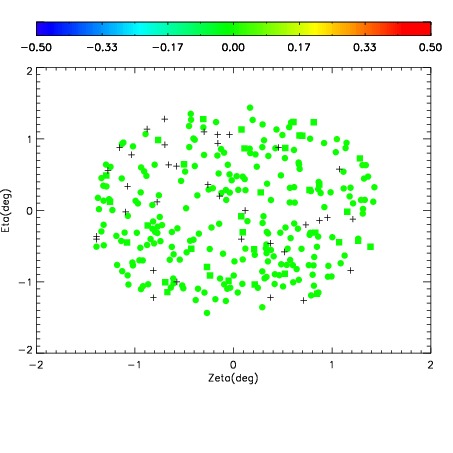
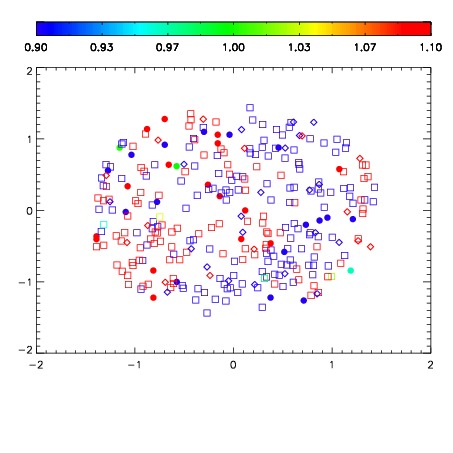


| Frame | Nreads | Zeropoints | Mag plots | Spatial mag deviation | Spatial sky 16325A emission deviations (filled: sky, open: star) | Spatial sky continuum emission | Spatial sky telluric CO2 absorption deviations (filled: H < 10) | |||||||||||||||||||||||
| 0 | 0 |
|
|
|
|
|
|
| IPAIR | NAME | SHIFT | NEWSHIFT | S/N | NAME | SHIFT | NEWSHIFT | S/N |
| 0 | 07000100 | 0.484494 | 0.00000 | 19.0113 | 07000101 | 0.00150838 | 0.482986 | 19.0020 |
| 1 | 07000104 | 0.481631 | 0.00286299 | 19.0869 | 07000105 | 0.00169963 | 0.482794 | 19.1162 |
| 2 | 07000103 | 0.479590 | 0.00490400 | 19.0503 | 07000106 | 0.00133357 | 0.483160 | 19.0576 |
| 3 | 07000107 | 0.479080 | 0.00541401 | 19.0147 | 07000102 | 0.00291583 | 0.481578 | 19.0484 |
| 4 | 07000108 | 0.481822 | 0.00267199 | 19.0013 | 07000109 | 0.000769595 | 0.483724 | 18.9926 |
| 5 | 07000099 | 0.481751 | 0.00274301 | 18.9486 | 07000098 | 0.00000 | 0.484494 | 18.9305 |