| Red | Green | Blue | |
| z | 17.64 | ||
| znorm | Inf | ||
| sky | -NaN | -NaN | -NaN |
| S/N | 24.0 | 41.0 | 43.5 |
| S/N(c) | 0.0 | 0.0 | 0.0 |
| SN(E/C) |
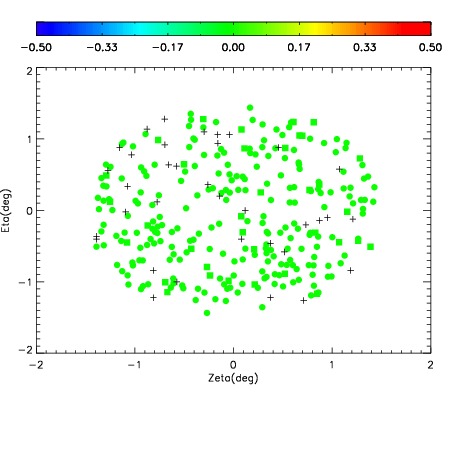
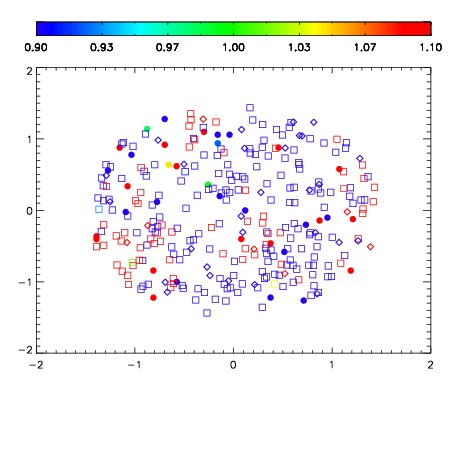


| Frame | Nreads | Zeropoints | Mag plots | Spatial mag deviation | Spatial sky 16325A emission deviations (filled: sky, open: star) | Spatial sky continuum emission | Spatial sky telluric CO2 absorption deviations (filled: H < 10) | |||||||||||||||||||||||
| 0 | 0 |
|
|
|
|
|
|
| IPAIR | NAME | SHIFT | NEWSHIFT | S/N | NAME | SHIFT | NEWSHIFT | S/N |
| 0 | 07630016 | 0.473883 | 0.00000 | 18.9143 | 07630014 | 0.00305504 | 0.470828 | 18.8774 |
| 1 | 07630015 | 0.471951 | 0.00193200 | 18.9601 | 07630013 | 0.00532907 | 0.468554 | 18.8950 |
| 2 | 07630011 | 0.471791 | 0.00209200 | 18.8242 | 07630017 | 0.00600719 | 0.467876 | 18.8466 |
| 3 | 07630012 | 0.473443 | 0.000440001 | 18.7941 | 07630010 | 0.00000 | 0.473883 | 18.8202 |