| Red | Green | Blue | |
| z | 17.64 | ||
| znorm | Inf | ||
| sky | -Inf | -NaN | -Inf |
| S/N | 22.0 | 39.3 | 43.2 |
| S/N(c) | 0.0 | 0.0 | 0.0 |
| SN(E/C) |
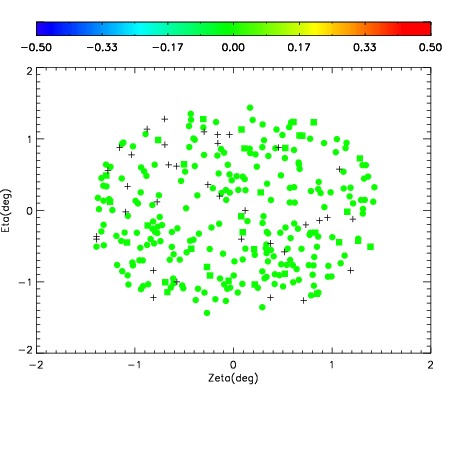
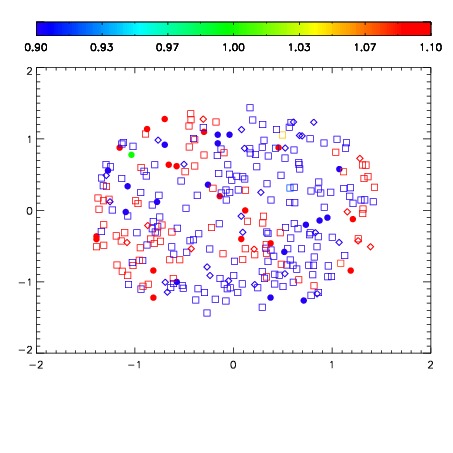


| Frame | Nreads | Zeropoints | Mag plots | Spatial mag deviation | Spatial sky 16325A emission deviations (filled: sky, open: star) | Spatial sky continuum emission | Spatial sky telluric CO2 absorption deviations (filled: H < 10) | |||||||||||||||||||||||
| 0 | 0 |
|
|
|
|
|
|
| IPAIR | NAME | SHIFT | NEWSHIFT | S/N | NAME | SHIFT | NEWSHIFT | S/N |
| 0 | 07890043 | 0.473606 | 0.00000 | 18.8542 | 07890041 | -0.000792593 | 0.474399 | 18.8820 |
| 1 | 07890042 | 0.472203 | 0.00140300 | 18.8912 | 07890044 | 0.000399812 | 0.473206 | 18.9029 |
| 2 | 07890039 | 0.471902 | 0.00170398 | 18.8197 | 07890037 | 0.00000 | 0.473606 | 18.8175 |
| 3 | 07890038 | 0.470758 | 0.00284800 | 18.8076 | 07890040 | 0.000698126 | 0.472908 | 18.7166 |