| Red | Green | Blue | |
| z | 17.64 | ||
| znorm | Inf | ||
| sky | -NaN | -NaN | -Inf |
| S/N | 20.9 | 34.6 | 39.9 |
| S/N(c) | 0.0 | 0.0 | 0.0 |
| SN(E/C) |
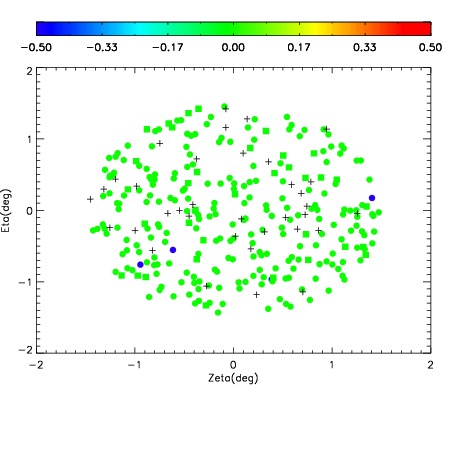
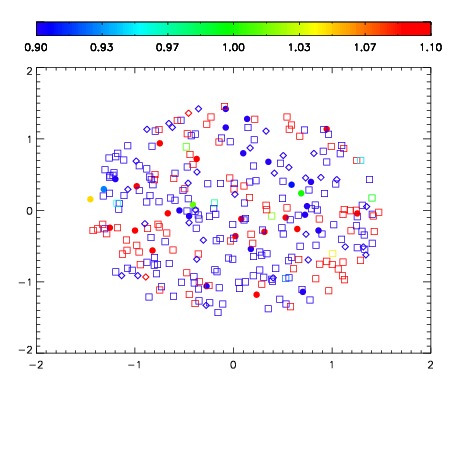


| Frame | Nreads | Zeropoints | Mag plots | Spatial mag deviation | Spatial sky 16325A emission deviations (filled: sky, open: star) | Spatial sky continuum emission | Spatial sky telluric CO2 absorption deviations (filled: H < 10) | |||||||||||||||||||||||
| 0 | 0 |
|
|
|
|
|
|
| IPAIR | NAME | SHIFT | NEWSHIFT | S/N | NAME | SHIFT | NEWSHIFT | S/N |
| 0 | 07630023 | 0.469025 | 0.00000 | 18.7589 | 07630021 | 0.00000 | 0.469025 | 18.6691 |
| 1 | 07630022 | 0.467922 | 0.00110298 | 18.7875 | 07630025 | -0.00196441 | 0.470989 | 18.7553 |
| 2 | 07630026 | 0.466159 | 0.00286600 | 18.7689 | 07630028 | 0.00130282 | 0.467722 | 18.7180 |
| 3 | 07630027 | 0.466783 | 0.00224200 | 18.7243 | 07630024 | -0.00197030 | 0.470995 | 18.6631 |